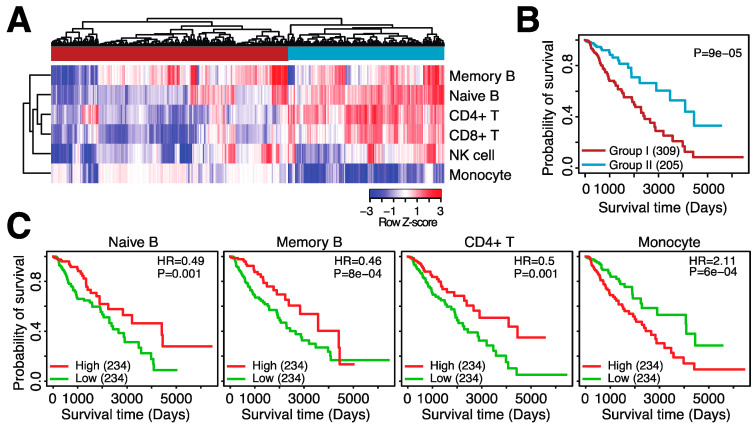
Figure 2.
Patterns of immune infiltration in low-grade glioma. (A). Heatmap depicting the infiltration scores for six immune cell types in TCGA-LGG. Top sidebar indicates the grouping of the samples based on hierarchical clustering. (B). Kaplan–Meier plot depicting differential overall survival between group I and group II. (C). Kaplan–Meier plots comparing low and high infiltration of four immune cell types. HR = hazard ratio. p = log-rank p-value.

