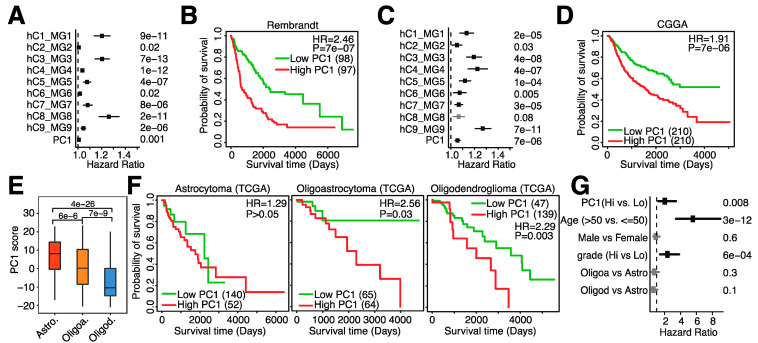
Figure 4.
Microglia abundance is negatively associated with prognosis in independent datasets and subtypes of low-grade glioma. (A). Hazard ratios of univariate Cox regression models evaluating the association between overall survival and 9 human microglia signatures and PC1 in the Rembrandt dataset. (B). Kaplan–Meier plot depicting the association between overall survival and PC1 in the Rembrandt dataset. (C). Hazard ratios of univariate Cox regression models evaluating the association between overall survival and 9 human microglia signatures and PC1 in the CGGA dataset. (D). Kaplan–Meier plot depicting the association between overall survival and PC1 in the CGGA dataset (mRNAseq_693). (E). Boxplot comparing PC1 scores among glioma subtypes. Astro. = astrocytoma, Oligoa. = oligoastrocytoma and Oligod. = oligodendroglioma. (F). Kaplan–Meier plots depicting the association between overall survival and PC1 in different glioma subtypes in the TCGA dataset. (G). Forest plot depicting hazard ratios of univariate Cox regression models evaluating the association between overall survival and several clinical parameters.

