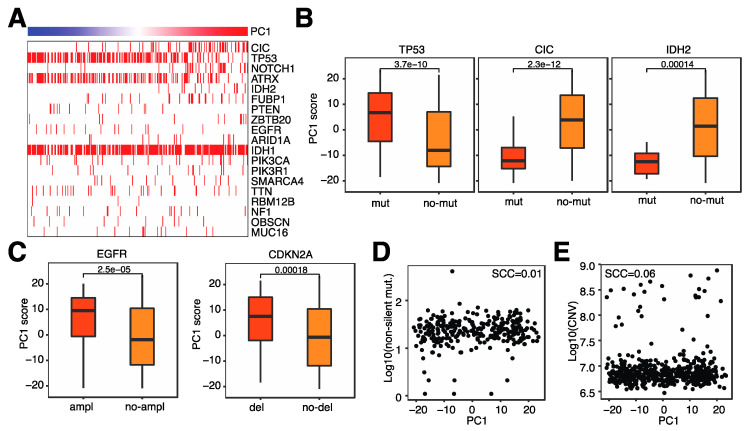
Figure 6.
Microglia infiltration is associated with specific genomic alterations. (A). Heatmap indicating the incidence of coding mutations (horizontal red bars) and the level of microglia infiltration (top bar). (B). Box plot of microglia infiltration in patients with or without coding mutations in the specified genes. (C). Box plot of microglia infiltration in patients with or without copy number variations (CNVs) in the specified genes. (D). Relationship between microglia infiltration and the number of non-silent mutations. (E). Relationship between microglia infiltration and total CNVs.

