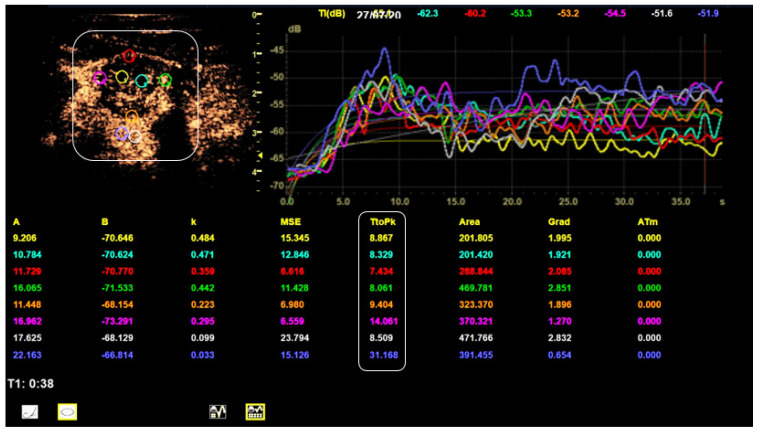
Figure 6.
TIC analysis of a right thyroid lobe with thyroid carcinoma. The smoothed TICs for every ROI are depicted in the upper right corner. The measured TTP values (bottom white box) meet the calculated malignancy criteria cut-off values: The 2 central values are lower than 13.5 s and the 3 out 4 marginal values are lower than 13.1 s.

