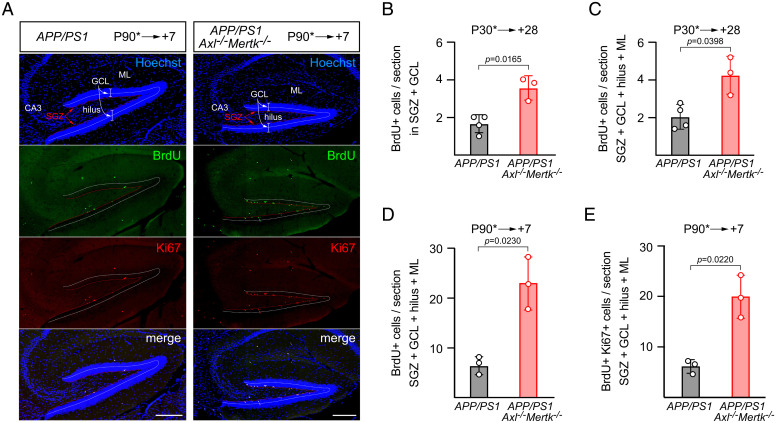
Fig. 4.
Excess newborn cells in the APP/PS1 and APP/PS1Axl−/−Mertk−/− dentate gyrus. (A) Representative panels of the same sagittal sections through the V-shaped DG of APP/PS1 (Left panels) and APP/PS1Axl−/−Mertk−/− mice (Right panels) in which dividing cells were pulse labeled with BrdU at P90 and then analyzed 7 d later. Top row, cell nuclei labeled with the DNA dye Hoechst 33258; second row, BrdU-labeled nuclei visualized with an anti-BrdU antibody; third row, cells positive for the proliferation marker Ki67 visualized with an anti-Ki67 antibody; and Bottom row, merged images. Relevant hippocampal regions indicated in the Top panels are ML, molecular layer; GCL, granule cell layer; SGZ, subgranular zone; CA3, cornu ammonis field 3. Dotted lines indicate the center of the GCL (white) and the thin layer of the SGZ (red). (B and C) Quantification of BrdU+ cells in the indicated regions of APP/PS1 and APP/PS1Axl−/−Mertk−/− mice pulse labeled at P30 and analyzed 28 d later. (D and E) Quantification of BrdU+ cells in the indicated regions of APP/PS1 and APP/PS1Axl−/−Mertk−/− mice pulse labeled at P90 and analyzed 7 d later. Data are average from five serial hippocampal sections per animal and n = 3 to 4 per genotype. Unpaired t test. (Scale bars, 200 μm.)

