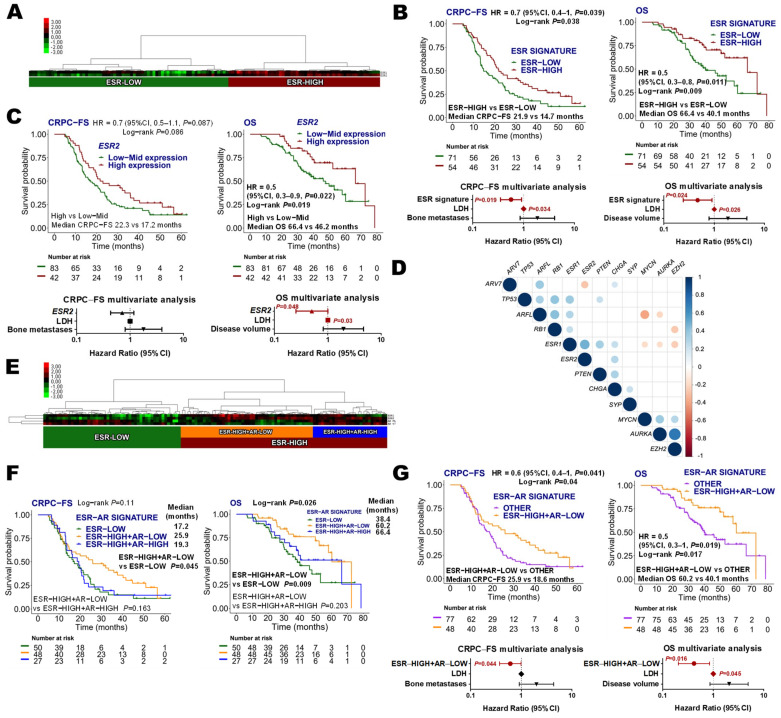
Figure 3.
Estrogen receptor (ESR) signature. (A) Hierarchical clustering expression heatmap for expression values of the ESR signature; (B) Kaplan–Meier curves representing CRPC-free survival (CRPC-FS) and overall survival (OS) according to ESR signature and forest plots representing the multivariate analysis; (C) Kaplan–Meier curves representing CRPC-FS and OS according to ESR2 expression segregated into tertiles and forest plots representing the multivariate analysis; (D) correlation matrix of ESR, AR, neuroendocrine (AURKA, CHGA, SYP, MYCN, and EZH2) and tumor suppressor (TP53, RB1 and PTEN) genes. Correlation coefficients (r) between expression values are represented when p < 0.05; (E) hierarchical clustering expression heatmap for expression values of the ESR and AR genes; (F) Kaplan–Meier curves representing CRPC-FS and OS according to ESR and AR genes; (G) Kaplan–Meier curves representing CRPC-FS and OS according to ESR-High+AR-low and the other groups and forest plots representing the multivariate analysis. LDH: lactate dehydrogenase; HR: hazard ratio; CI, confidence interval.

