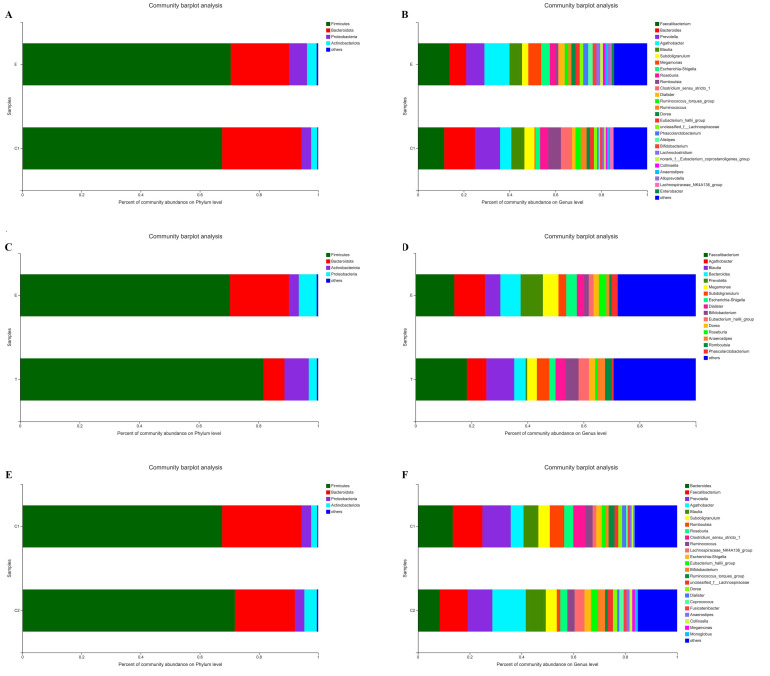
Figure 1.
Comparisons of the intestinal microbiome composition in different groups before and after exercise intervention. (A,C,E) The relative abundance of each phylum in each group. (B,D,F) The relative abundance of each genus in each group. Different colors represent different phyla or genera. E: the experimental group before exercise intervention; T: the experimental group after exercise intervention; C1: the control group before exercise intervention; C2: the control group after exercise intervention.

