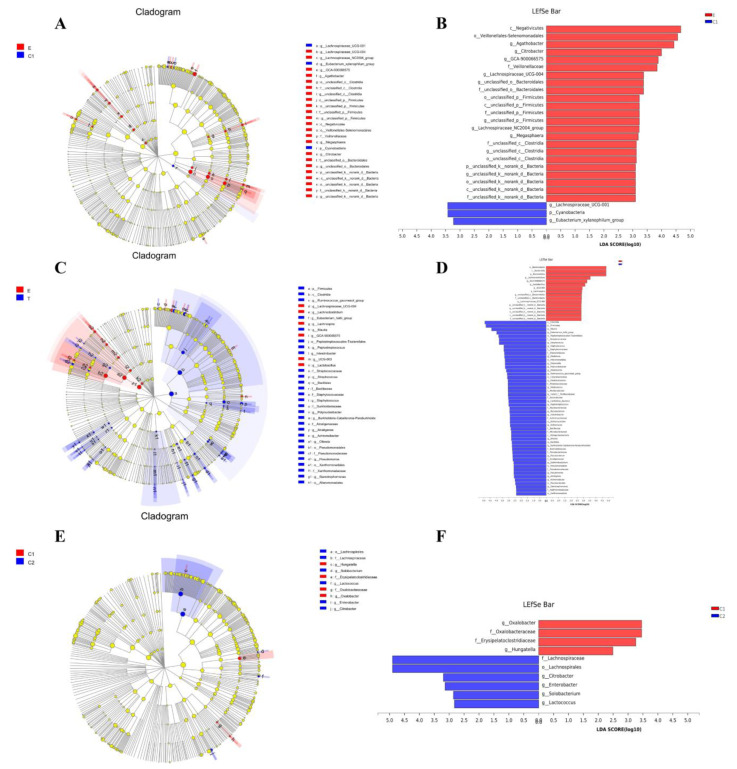
Figure 4.
LEfSe analysis of the difference in the abundance of the gut microbiota in each group. (A,C,E) Cladograms showing the taxonomic hierarchy of the main taxa from the phylum to genus (from inner to outer) in the sample community. (B,D,F) LDA score showing the abundance of different taxa in the intestinal flora between the groups. LEfSe: linear discriminant analysis effect size; LDA: linear discriminant analysis; E: experimental group before exercise intervention; T: experimental group after exercise intervention; C1: control group before exercise intervention; C2: control group after exercise intervention.

