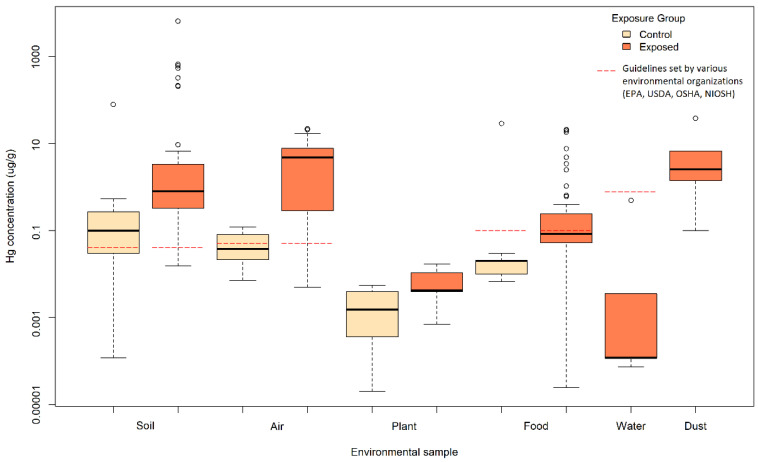
Figure 3.
Central Tendency Values of Mercury in Environmental Samples Exposed to E-Waste. The data are represented as boxplots based on data from individual studies (indicated as circles when they are out of the boxplot range). Control sample refer to exposure group 3 or exposure group 4, and exposed samples refer to exposure group 1 or exposure group 2 depending on the data available. Guidelines for each media were extracted from the average European topsoil mercury concentration for soil [21], OSHA and NIOSH for air [22], the USDA for food [23], and the U.S. EPA for water [24].

