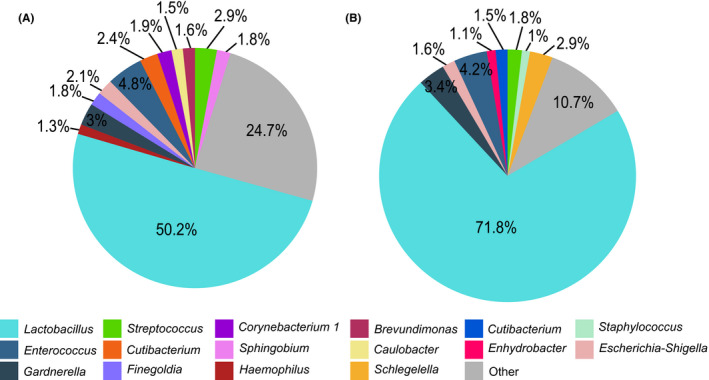
FIGURE 1.

The relative abundance of genera in the (A) endometrial tissue biopsy and (B) endometrial fluid samples. Genera present in at least 10% of the samples and with relative abundance of at least 1% are plotted, genera with relative abundance of <1% are concatenated together as “Other”
