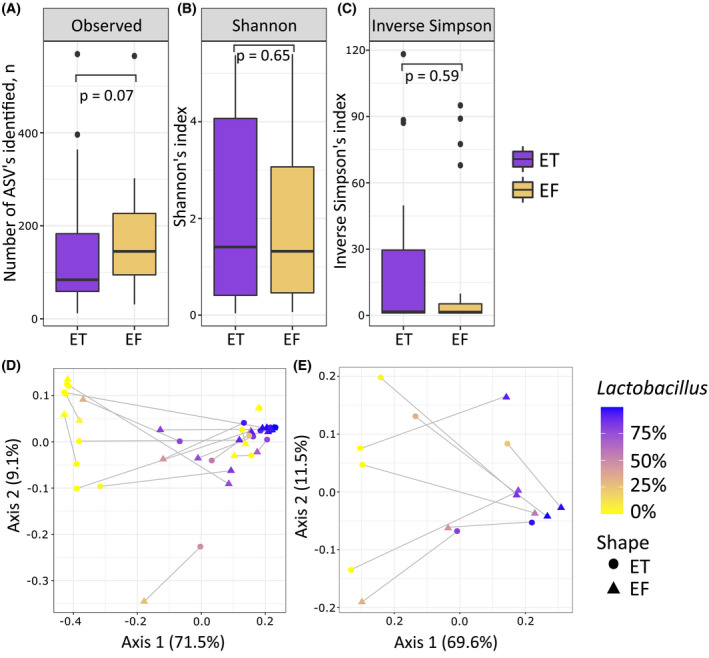
FIGURE 2.

Visualizations of alpha and beta diversity analysis. Boxplots representing alpha diversity of the endometrial tissue (ET) and endometrial fluid (EF) samples: richness (A), Shannon index (B) and inverse Simpson index (C). Weighted UniFrac principal coordinate analysis (PCoA) plot (D) representing beta diversity. In (A–C) color indicates the sample type. Weighted UniFrac PCoA plot (E) representing beta diversity in individuals with sample pairs where one of the samples was Lactobacillus dominated and the other samples was non‐Lactobacillus dominated. In (D, E) color indicates the relative abundance of Lactobacillus, shape indicates sample type (triangle for EF and circle for ET) and gray lines connect the samples belonging to the same individual
