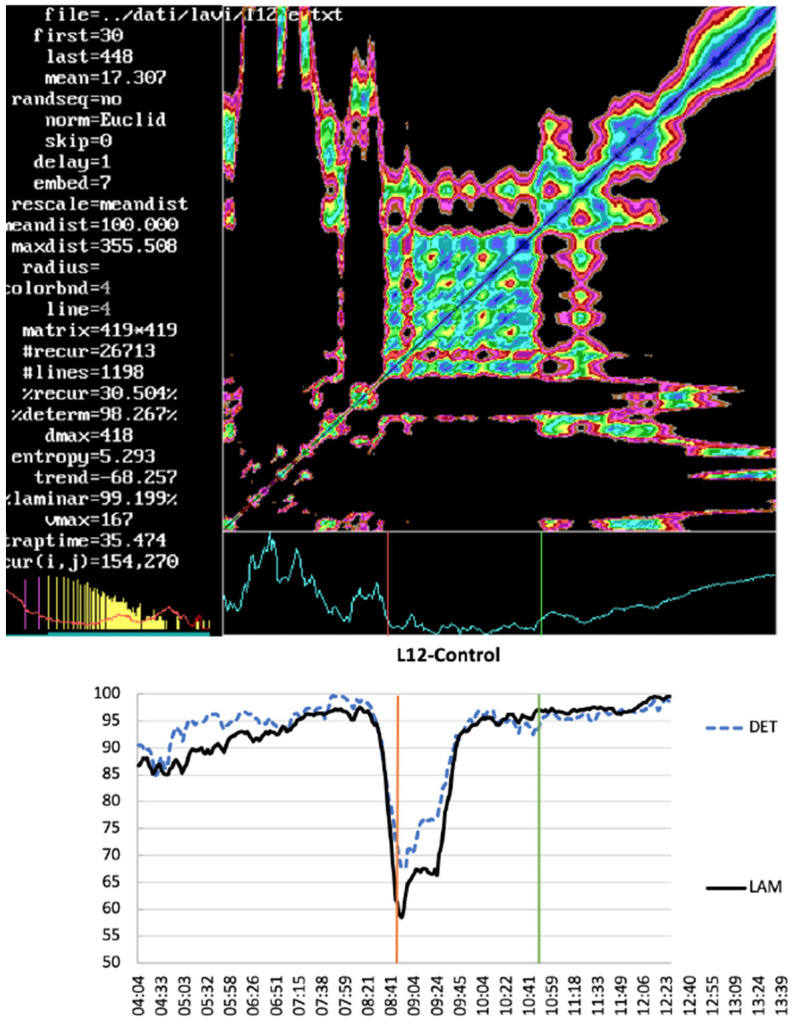
Figure A1.
Top panel: the same picture as Figure 5. Bottom panel: the percentage of recurrence points which form diagonal lines (DET) and the percentage of recurrence points which form vertical lines (LAM) epoch by epoch vs. time (min:sec) of detrended RR interval of Figure 5 (light blue line), recorded as a breath-by-breath, from a CPET device (Cosmed, Rome, Italy), in the sub-maximal test where the workload changed every 60 s. The red line highlights the statistically relevant minimum that corresponds to the AerT, and the green line corresponds to the AnT where the percent of determinism reaches saturation (see Appendix A.4).

