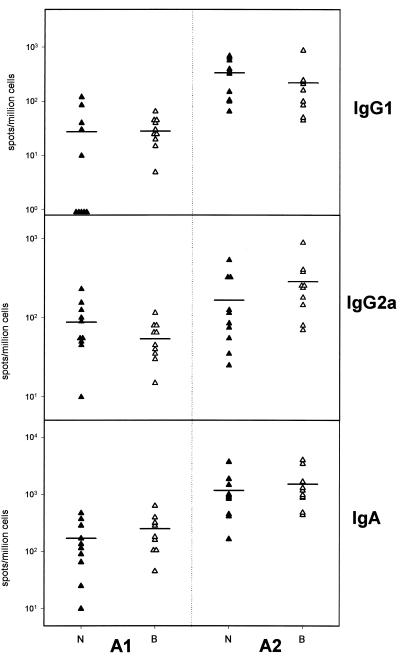
FIG. 3.
Values for local IgA, IgG1, and IgG2a measured by ELISPOTs in the salivary glands 2 weeks after the nasal boost and expressed as number of spots per million cells. A1, mice primed in presence of adjuvant A1; A2, mice primed in the presence of adjuvant A2; B, mice primed in the back (open triangles); N, mice primed in the neck (closed triangles). Means are represented by horizontal bars. Negative controls (eight mice) were negative for all isotypes considered (data not shown).

