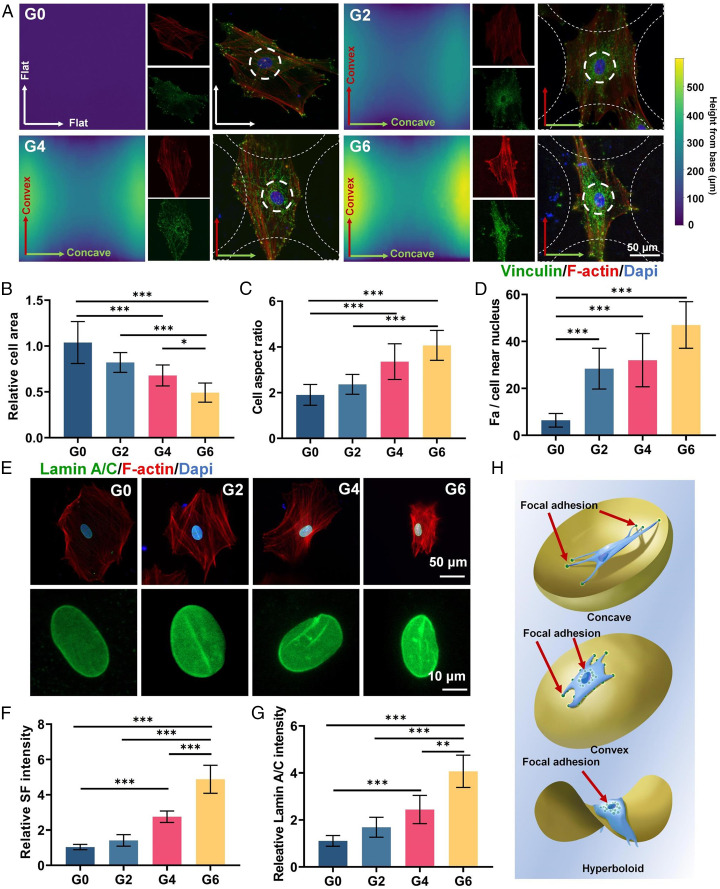
Fig. 4.
Effect of hyperboloid topology on SF, vinculin, and lamin A/C expression. (A) Immunofluorescence staining of vinculin (green), F-actin (red), and nuclei (blue) of hMSCs on hyperboloid surfaces. (B–D) Quantification of cell area, cell aspect ratio, and number of FAs near nuclei. (E) Immunofluorescence staining of lamin A/C (green), F-actin (red), and nuclei (blue) in hMSCs on hyperboloid surfaces. (F and G) Quantification of SF and lamin A/C intensity. (H) Schematic illustration of topology-induced cytoskeleton organization on concave, convex, and hyperboloid surfaces. The red arrows indicate the focal adhesion sites of the cells. Sample size n = 10 for all experiments by one-way ANOVA with Tukey’s post hoc test for multiple comparisons. Data are presented as mean ± SD. *P < 0.05, **P < 0.01, and ***P < 0.001 denote statistical significance.

