Fig. 5.
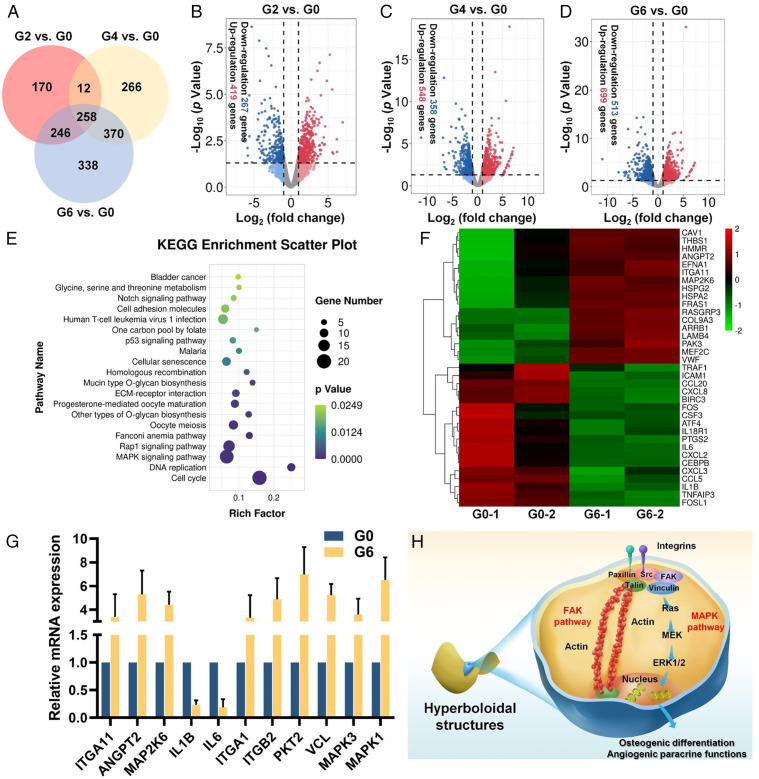
Bioinformatic analysis of gene expression of hMSCs on different TPMS scaffolds. (A) Venn diagram illustration of the DEGs between the TPMS scaffolds (G2, G4, and G6) and the conventional truss scaffold (G0). (B–D) Volcano plots of transcriptomic analysis of DEGs in (B) G2 versus G0, (C) G4 versus G0, and (D) G6 versus G0. (E) Up-regulated enriched Kyoto Encyclopedia of Genes and Genomes pathways of G6 versus G0. (F) Heatmap evaluation of DEGs involved in ECM–receptor interaction, cell adhesion molecule, MAPK, and proinflammatory signaling pathways. (G) Relative messenger RNA expression evaluation of targeted genes via qRT-PCR. (H) Schematic illustration of potential integrin-mediated FAK and MAPK pathway activation mechanism of hMSCs’ osteogenic differentiation and angiogenic paracrine response on the hyperboloidal structure.

