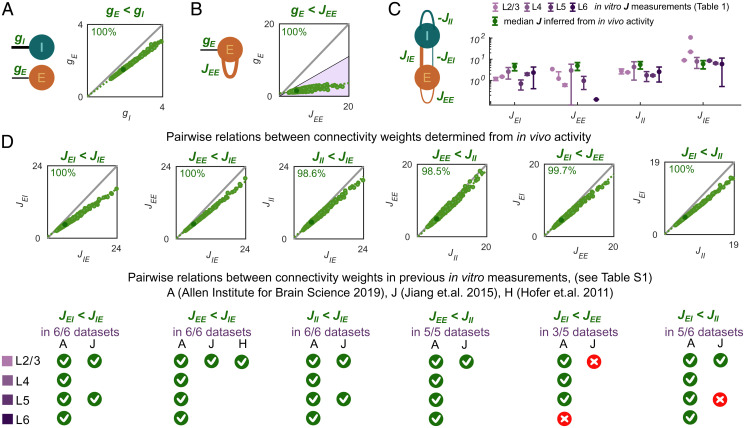
Fig. 4.
Comparison of the cortical and thalamic input weights inferred from the contrast responses and computed based on the direct experimental connectivity measurements. (A) The thalamic input weights to E cortical population were lower than the I-weights in 100% of the inferred connectivity parameter sets. (B) For cortical E neurons, the weight gE of the dLGN input was lower than the recurrent cortical weight JEE in 100% of the inferred connectivity parameter sets. The colored area (purple) comprises relations between JEE and gE for which thalamic contribution of excitatory input entering the E cortical population would be smaller than the experimentally determined upper bound of (53, 54). (C) The connectivity weights between V1 populations computed from previously published in vitro measurements have largely the same increasing order as the connectivity parameters obtained from our SSN-based inference procedure based on in vivo activity. (D) Most of the pairwise relations between connectivity weights (Fig. 3H) inferred from in vivo activity were consistent with relations computed from previous in vitro measurements (SI Appendix, Table S1).

