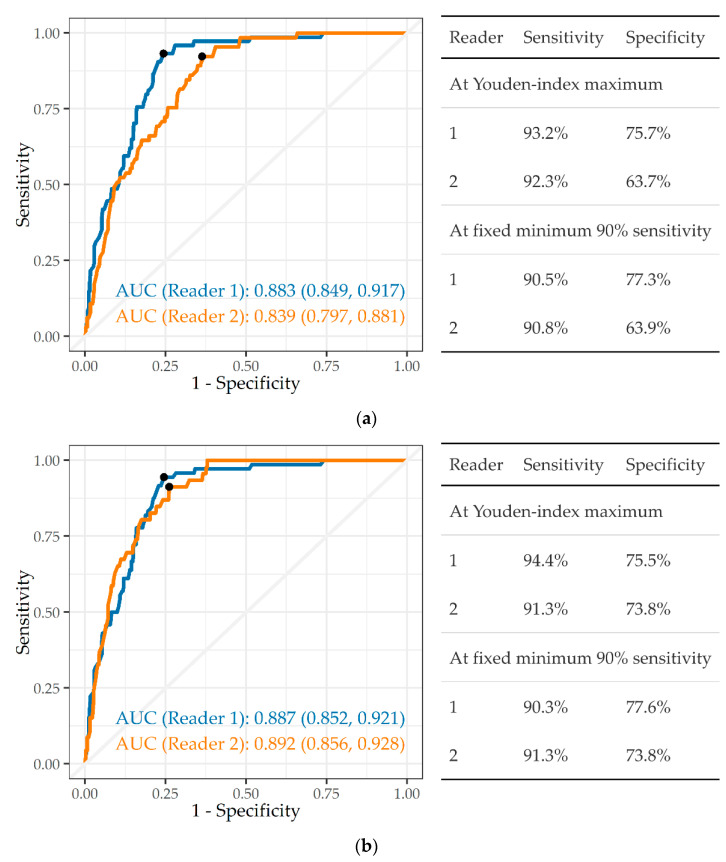
Figure 4.
(a) ROC curve, AUC, and sensitivity and specificity of a single CAD system (A) in detecting silicotuberculosis, ILO silicosis profusion ≥ 1/0, against readers 1 and 2 (n = 501). (b) ROC curve, AUC, and sensitivity and specificity of a single CAD system (A) in detecting silicotuberculosis, ILO silicosis profusion ≥ 1/1, against readers 1 and 2 (n = 501).

