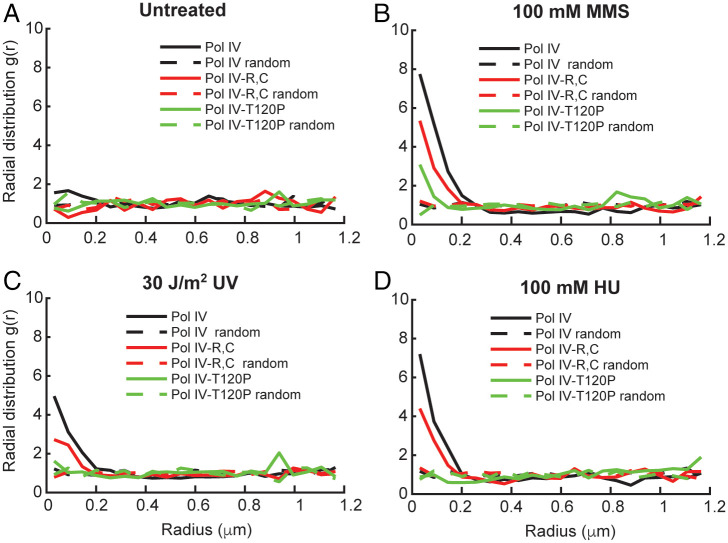
Fig. 1.
Effect of MMS, UV, and HU treatment on single-cell colocalization of Pol IV–PAmCherry and SSB–mYPet. Graphs of the radial distribution function g(r) between each static Pol IV–PAmCherry track and the nearest SSB–mYPet focus for Pol IVWT (black), Pol IVR,C (red), and Pol IVT120P (green) in (A) untreated cells (n = 1,482, 1,090, and 878, respectively) and cells treated with (B) 100 mM MMS (n = 2,754, 2,894, and 2,331, respectively), (C) 30 J/m2 UV light (n = 2,681, 3,261, and 1,142, respectively), and (D) 100 mM HU (n = 1,539, 1,479, and 1,207, respectively).

