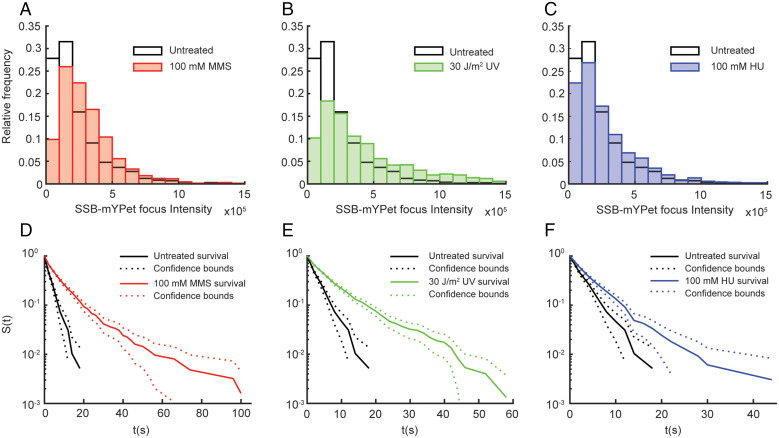
Fig. 3.
Effect of MMS, UV, and HU treatment on SSB–mYPet focus intensity and survival time of static SSB–PAmCherry tracks. Distributions of integrated SSB–mYPet focus intensity in untreated cells (white; n = 2,138) and (A) cells treated with 100 mM MMS (red; n = 1,309), (B) 30 J/m2 UV light (green; n = 2,015), and (C) 100 mM HU (blue; n = 1,207). Raw survival curves, given by the survivor function (S(t)), of static SSB–PAmCherry tracks in untreated (black; n = 545) cells and (D) MMS-treated (red; n = 1,171), (E) UV-treated (green; n = 1,755), and (F) HU-treated (blue; n = 956) cells measured with a 2-s stroboscopic interval.

