Fig. 3.
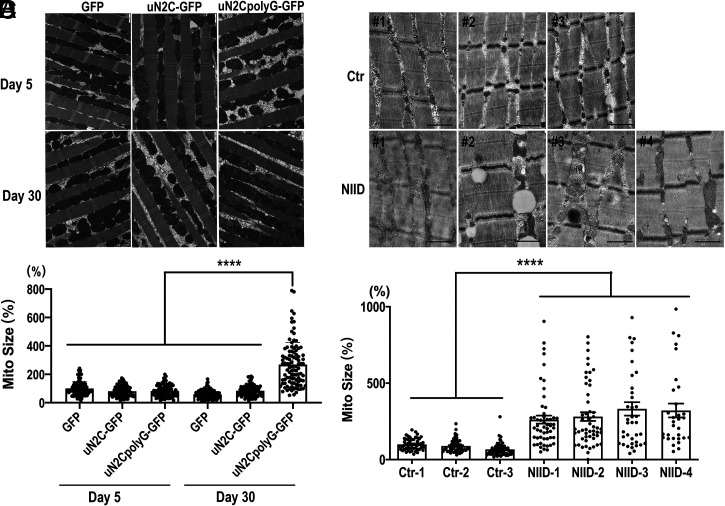
EM analysis showing increased mitochondrial size in muscle samples from flies expressing uN2CpolyG and NIID patients. (A) Muscle fibers were intact in flies expressing GFP, uN2C-GFP, and uN2CpolyG-GFP at both day 5 and day 30. Normal mitochondrial size was observed in three groups expressing GFP, uN2C-GFP, and uN2CpolyG-GFP at day 5. Meanwhile, increased mitochondrial size was observed in flies expressing uN2CpolyG-GFP at day 30 compared with five other groups. (B) Statistical analysis of mitochondrial size in flies expressing GFP, uN2C-GFP, and uN2CpolyG-GFP at day 5 and day 30. A significant difference was observed in uN2CpolyG-GFP–expressing flies at day 30 compared with five other groups. (C) Increased mitochondrial size was observed in four NIID patients compared with three normal controls. Massive lipid droplets accumulated in muscle fibers of patient NIID#2. (D) Statistical analysis of mitochondrial size in NIID patients and normal controls. A significant difference was observed between NIID patients and normal controls. Scale bar, 1 μm (A and B); ****P < 0.0001. Error bars correspond to the SEM. Ctr, control; Mito, mitochondrial.

