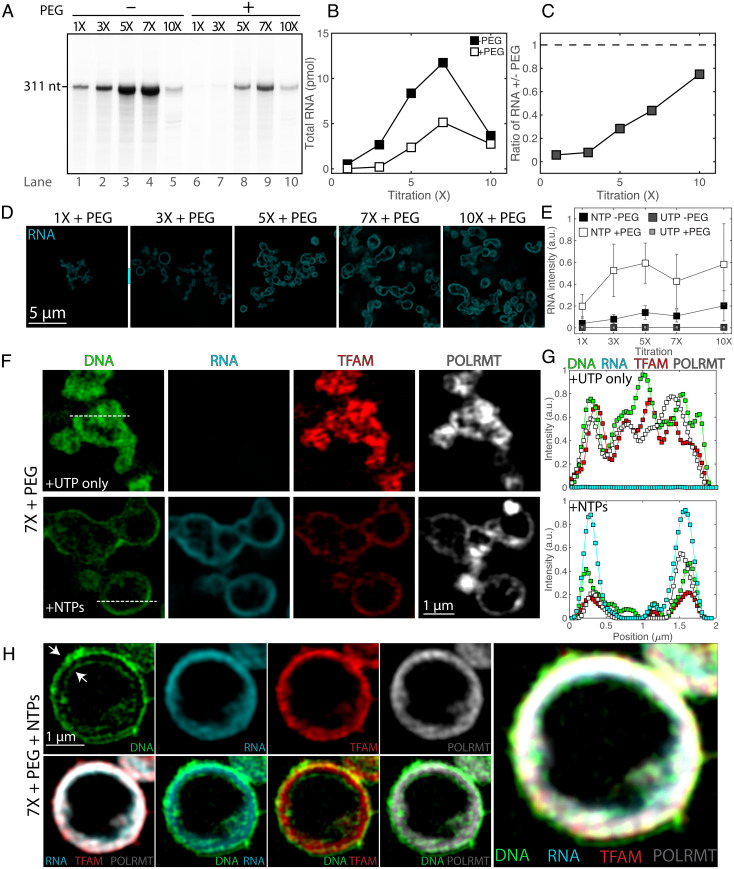
Fig. 2.
In vitro transcription under soluble and condensed conditions leads to changes in condensate organization. (A) RNA production rates at soluble and condensed states. The transcription run-off assay was performed using increasing concentrations (1× to 10×) of components of the transcription machinery (TFAM, TFB2M, and POLRMT) and DNA in the absence (lanes 1 to 5) or presence (lanes 6 to 10) of 5% PEG. (B) Quantification of RNA product from A as a function of reactant titration, where 0% PEG corresponds to filled squares, and 5% PEG corresponds to open squares. (C) Ratio of RNA production of crowded (5% PEG) to soluble (0% PEG) states as a function of reactant titration. Values in A–C illustrate a representative experiment. (D) SIM images of reactions after fixation and RNA fluorescence in situ hybridization (FISH), following 1 h of reactions under the same concentrations of transcription machinery and DNA as well as buffer composition as A with 2 mM NTPs. (Scale bar, 5 µm.) All images are at the same contrast settings. (E) Quantification of RNA FISH intensity under soluble (0% PEG) or condensed (5% PEG) conditions for the reactions (NTPs) and of the negative control (UTP); n = 3 experimental replicates, values represent averages, and error bars = SD. (F) SIM images of core mt-transcription components in condensates at 7× and 5% PEG for negative control (UTP only) and for reactions (NTPs), where DNA is in green, RNA FISH is in cyan, TFAM is in red, and POLRMT is in gray scale. (Scale bar, 1 µm.) Dashed lines indicate line profile. (G) Smoothed line profile for all components from F. (H) Images of a large vesicle after 1 h of transcription (7×, 5% PEG, NTPs). Panels include single channel of DNA, RNA, TFAM, and POLRMT (Top Left), overlays of RNA/TFAM/POLRMT, DNA/RNA, DNA/TFAM, and DNA/POLRMT (Bottom Left), and a four-channel overlay (Right). Arrows indicate the outer and inner lining of DNA. (Scale bar, 1 µm.)

