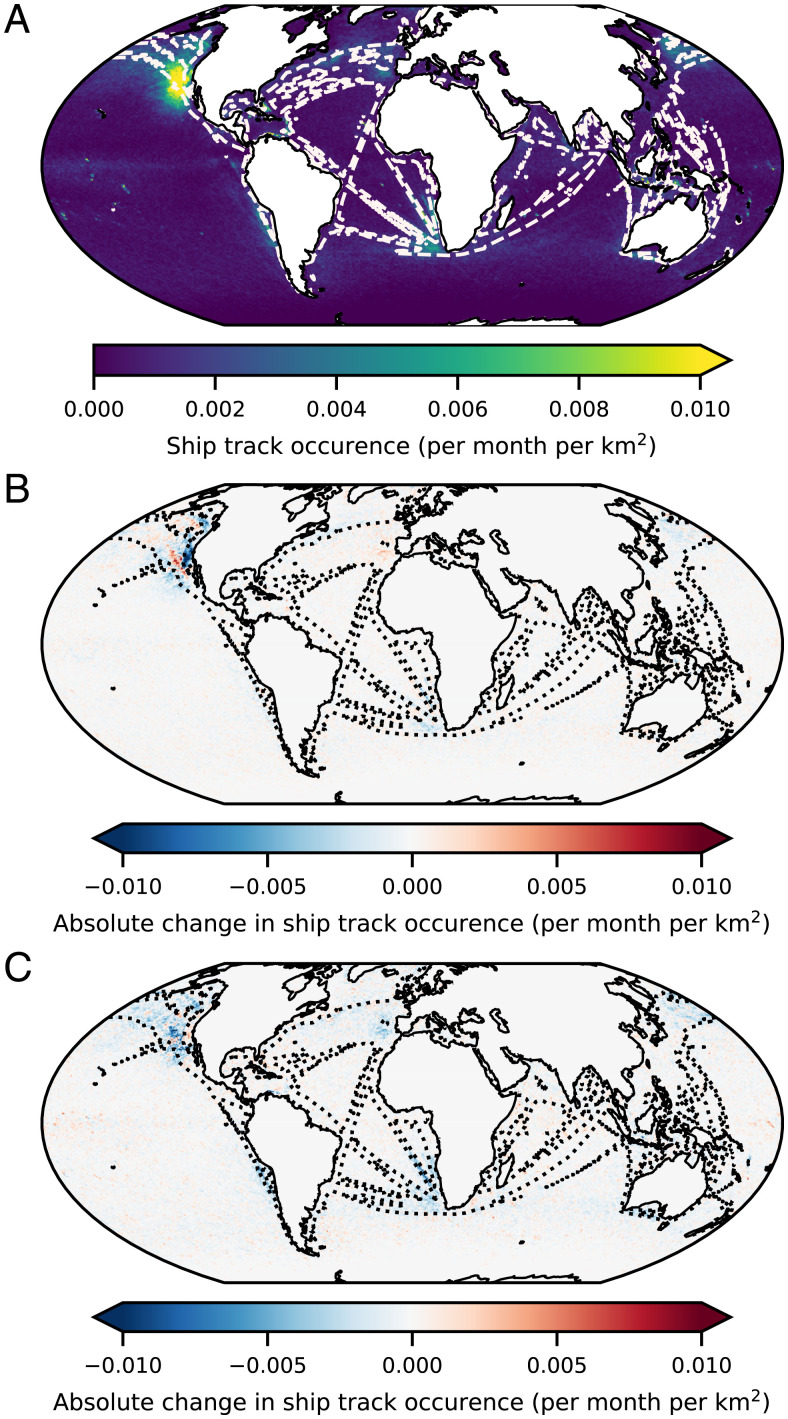
Fig. 1.
(A) The average monthly frequency of occurrence of ship tracks detected in Moderate Resolution Imaging Spectroradiometer (MODIS) Aqua imagery between 2002 and 2021 with a single contour level of average shipping emissions at 0.4 ng ⋅m−2 ⋅s−1 SO overlaid in white. (B) The absolute difference between the frequency of occurrence between 2002 to 2014 and 2015 to 2019 (inclusive), highlighting changes due to near-shore sulphur emission control area (SECA) emissions regulations. (C) The absolute difference between the frequency of occurrence between 2015 to 2019 and 2020 to 2021 (inclusive), highlighting changes due to IMO global shipping emissions regulations.

