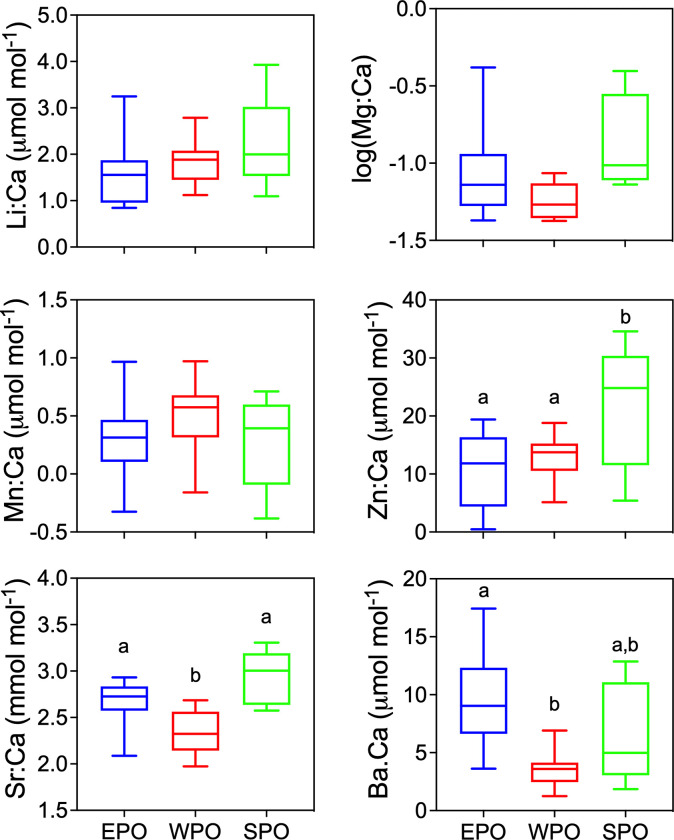
Fig 4. Boxplots of otolith edge values (mean of final 100 μm) for each region.
EPO = blue, WPO = red, SPO = green. One-way ANOVA significant differences (see Table 1) among regions were further tested with a Holm-Sidak multiple comparison test with lower case letters indicating regions that are significantly different; regions that were not significantly different share the same lower case letter.

