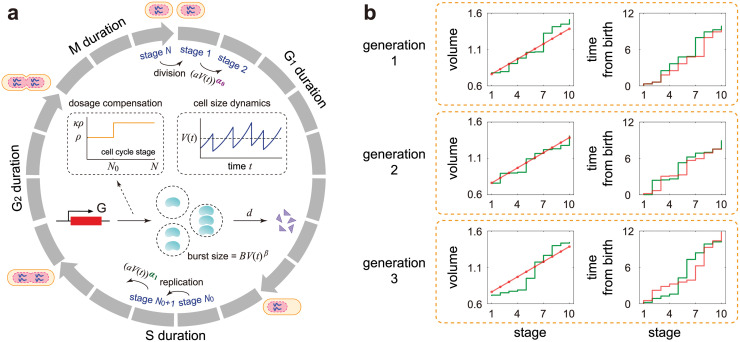
Fig 1. Model and its mean-field approximation.
A: A detailed stochastic model with both cell size and gene expression descriptions. The model consists of N effective cell cycle stages, gene replication at stage N0, cell division at stage N, bursty production of the gene product, and degradation of the gene product. The growth of cell volume is assumed to be exponential and gene dosage compensation is induced by a change in the burst frequency at replication from ρ to κρ with κ ∈ [1, 2) (see inset graphs). Both the transition rates between stages and the mean burst size depend on cell size in a power law form due to size homeostasis and balanced (or non-balanced) biosynthesis, respectively. The model also considers two-layer cell-size control with its strength varying from α0 to α1 upon replication. B: Schematics of the changes in cell volume and time from birth as a function of cell cycle stage k for the first three generations in the case of N = 10 and α0 = α1 = 1. In the full model (green curve), the gene expression dynamics is coupled with the following two types of fluctuations: noise in cell volume at each stage and noise in the time interval between two stages. The reduced model (red curve) ignores the former type of fluctuations by applying a mean-field approximation while retaining the latter type of fluctuations. Note that when α0 = α1 = 1, it follows from Eq (3) that the mean cell volume at stage k is vk = v1 + (k − 1)M0/N0, which linearly depends on k. The red dots in the stage-volume plot show the dependence of vk on k and the joining of these dots by a straight red line is simply a guide to the eye. The reduced model approximates the full model excellently when N is sufficiently large.

