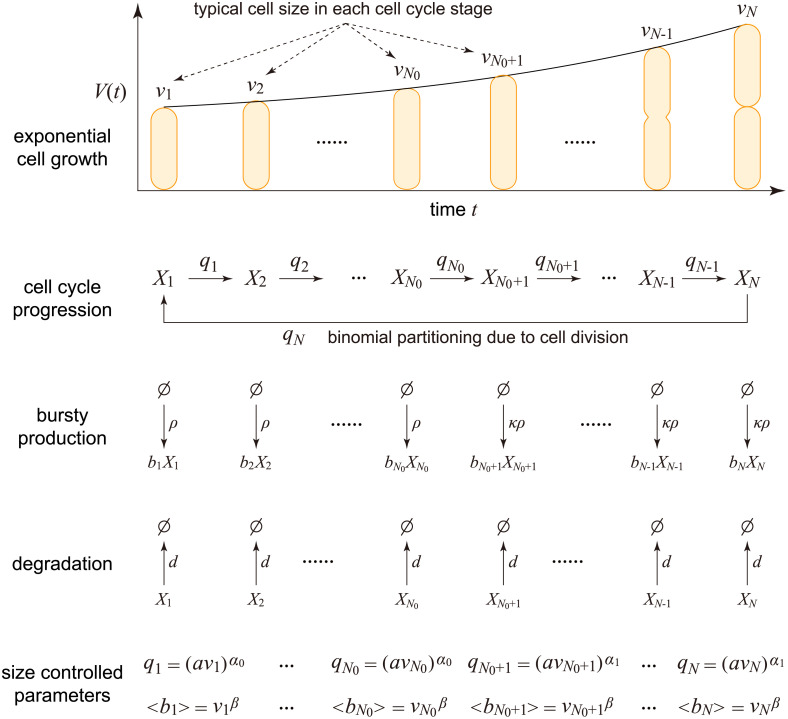
Fig 2. Reduced model obtained by making the mean-field approximation of cell size dynamics.
Here Xk denotes the gene product at stage k and bk denotes the burst size at stage k. Moreover, vk is the typical cell size at stage k, Bk is the mean burst size at stage k, and qk is the typical transition rate from stage k to the next.

