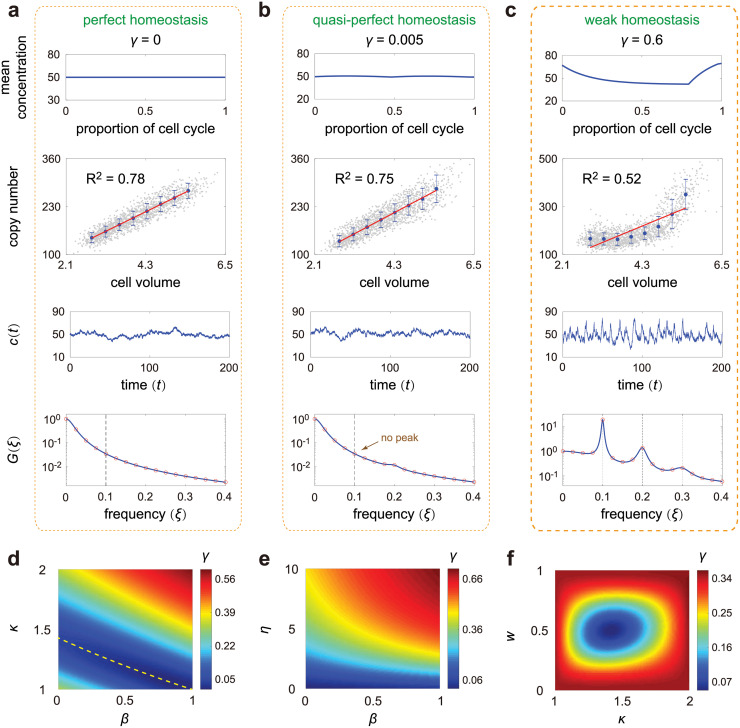
Fig 4. Concentration homeostasis and its relation to concentration oscillations.
A: Perfect homeostasis. The first row shows the mean concentration μk at cell cycle stage k versus the proportion of cell cycle before stage k, which can be computed explicitly as wk = log2(vk/v1). The second row shows the scatter plot of molecule number versus cell volume obtained from SSA. Here data are sorted into 8 bins according to cell volume, and the mean and variance of molecule numbers within each bin are shown by the blue dot and the error bar. The red curve is the regression line for the scatter plot. The third row shows typical time traces of concentrations, where c(t) denotes the concentration at time t for a single cell lineage. The fourth row shows the theoretical (blue curve) and simulated (red circles) power spectra of concentration fluctuations. The theoretical spectrum is computed from Eq (9), while the simulated spectrum is obtained by means of the Wiener-Khinchin theorem, which states that , where is the truncated Fourier transform of a single concentration trajectory over the interval [0, T] and the angled brackets denote the ensemble average over trajectories. The vertical lines show the cell cycle frequency f and its harmonics. B: Same as A but for quasi-perfect homeostasis. C: Same as A but for weak homeostasis. D: Heat plot of γ (the accuracy of concentration homeostasis) versus β (the degree of balanced biosynthesis) and κ (the strength of dosage compensation) when replication occurs halfway through the cell cycle (w = 0.5). The yellow dashed line shows the exponential curve , around which homeostasis is accurate. E: Heat plot of γ versus β and η (the stability of the gene product) when there is no dosage compensation (κ = 2). Stable gene products give rise to more accurate homeostasis than unstable ones. F: Heat plot of γ versus κ and w (the proportion of cell cycle before replication) when synthesis is non-balanced (β = 0). Homeostasis is the most accurate when and w = 0.5. See Section D in S1 Appendix for the technical details of this figure.

