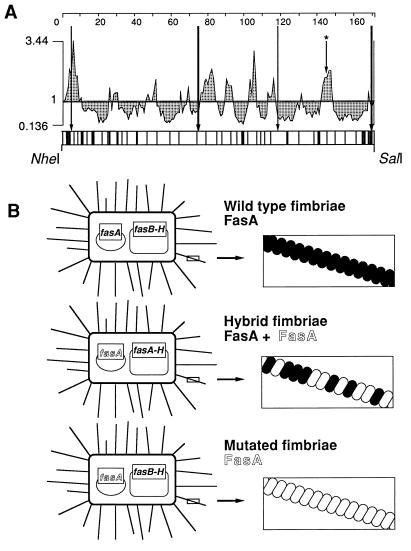
FIG. 1.
(A) Surface probability profile of FasA and mapping of linker insertion sites in fasA. Horizontal axis values correspond to the amino acid sequence of mature FasA. Vertical axis values are probabilities of surface exposure (21). Approximately 60 linker insertion sites were mapped by restriction analysis (±25 bp), as indicated by vertical bars in the bottom box, which represents the NheI-SalI-flanked fasA DNA segment encoding the mature FasA protein. Permissive linker insertion sites, more precisely identified by sequence analysis, are indicated by long arrows. The arrow with the asterisk indicates a construct specifically targeted at a predicted surface-exposed domain, which was later characterized as a nonpermissive site. (B) Comparison of 987P fimbria display systems illustrating bacteria containing two compatible and complementing plasmids to express wild-type fimbriae incorporating only wild-type FasA subunits (shown in black), hybrid fimbriae incorporating both wild-type FasA and mutated FasA subunits (shown in white), or mutated fimbriae incorporating only mutated FasA.

