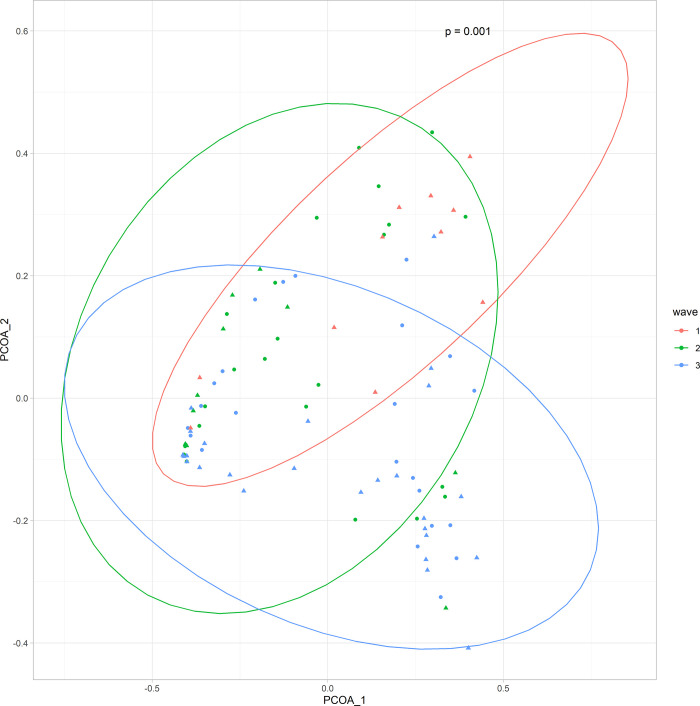
Fig 4. Beta diversity differences by collection date.
PCoA plot for genus-level differences in the nasopharyngeal microbiome based on Bray-Curtis dissimilarity stratified by collection date. Circles indicate community-dwelling SARS-CoV-2-infected subjects and triangles indicate hospitalized SARS-CoV-2-infected subjects.

