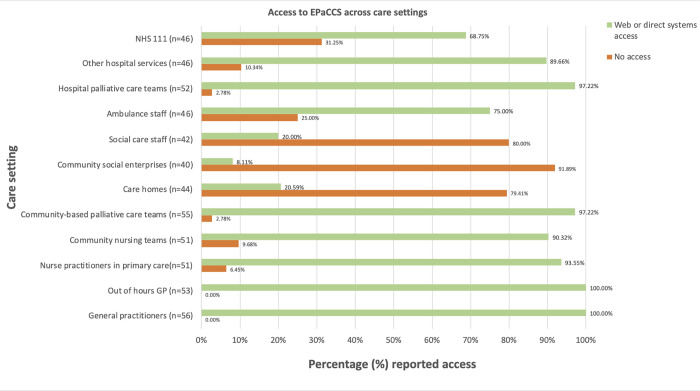
Fig 2. Bar chart reflecting CCG reported access to EPaCCS by care setting.
Key: Percentage (%) reported access is derived from number of CCGs reporting access as a proportion of the number of CCGs providing a response. Of 57 respondents, 56 CCGs indicate a method of access for any of the services, with 23 CCGs providing data for some and not all health professional groups. In some CCGs, more than one method of sharing information was selected for the same service type. Data underpinning data in the graph can be found in S2 Table.

