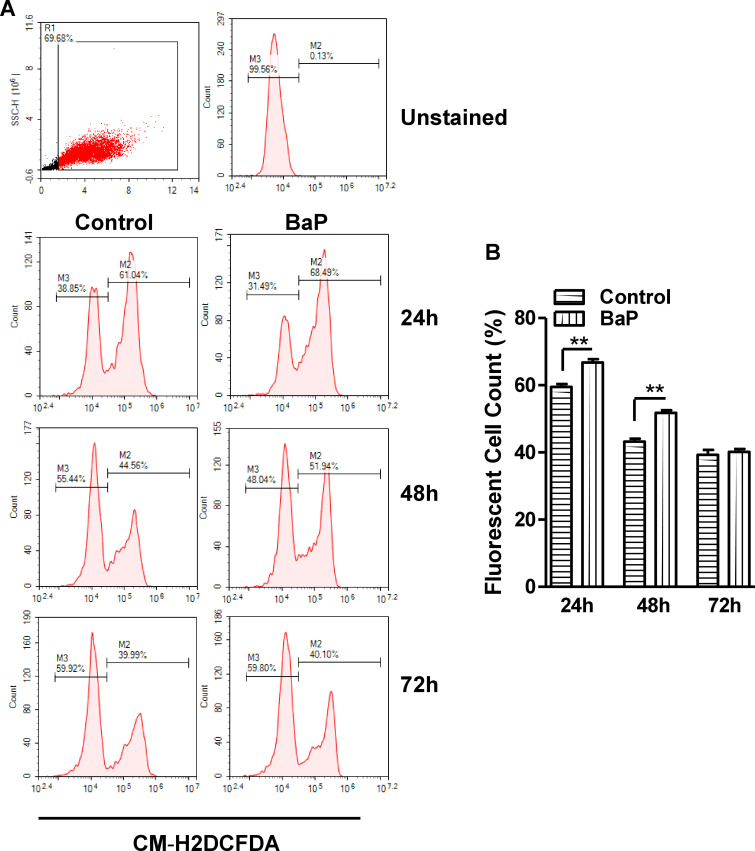
Fig 2.
Effect of BaP on ROS in U1 cells (A, B). (A) The U1 cells were treated with 1 μM BaP for 24, 48, and 72 h. ROS level using flow cytometry. (B) Data is quantified using florescent cell count that were measured in %. Statistical analyses were carried out by using Student’s t-test (two groups each time point). Results are expressed as means ± S.E.M of n = 3 experiments. **P ≤0.01 in comparison with untreated control.

