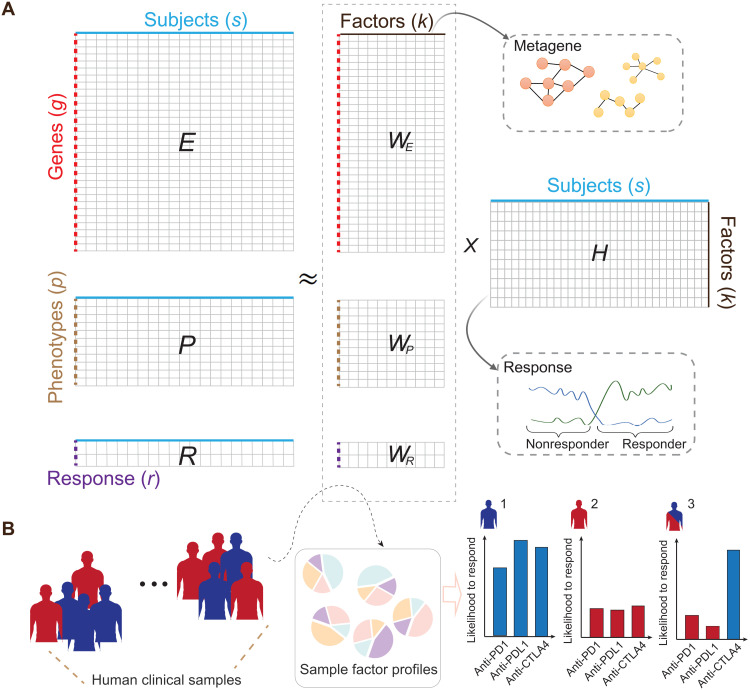
Fig. 1. Illustration of the dimension reductions to integrate transcriptomic, phenotypic, and ICB response data.
(A) The framework takes the gene expression matrix, mouse experimental variables, and ICB response data for joint dimension reduction through iterative updates. The model was trained with an extensive collection of syngeneic mouse model data with curated ICB response labels. The columns in the decomposition products WE can be collectively interpreted as metagenes to help inform the ICB resistance and response in the syngeneic mouse models. (B) Leveraging the decomposition outputs from the model, we could simulate an individual’s likelihood to respond to anti-PD1, anti-PDL1, or anti-CTLA4 treatment with available transcriptomic data.

