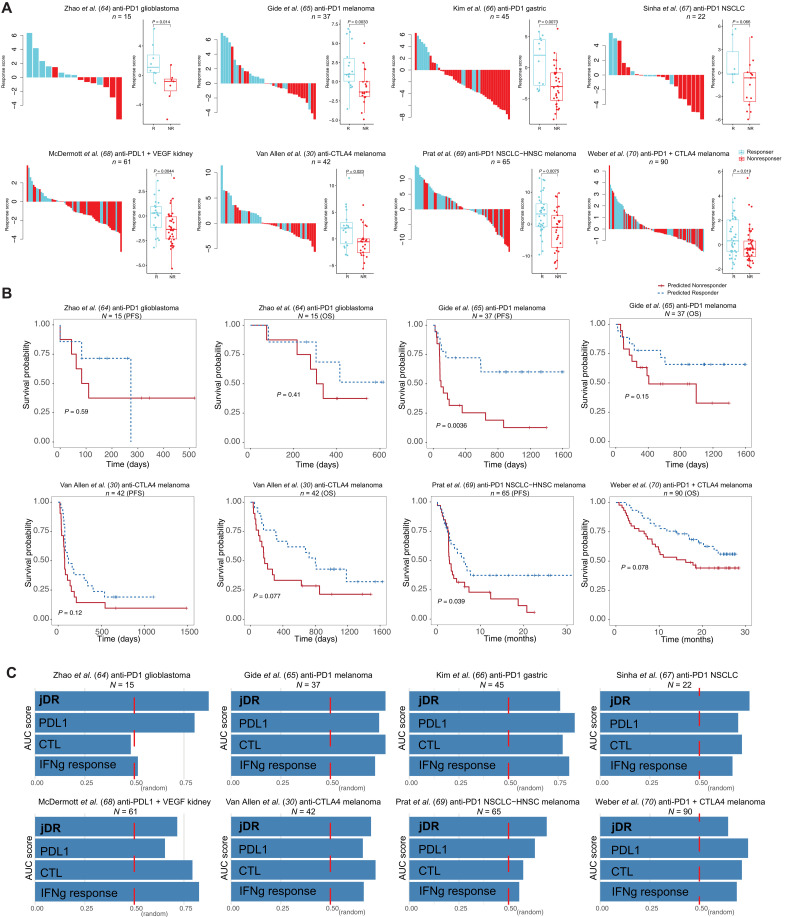
Fig. 3. The prediction accuracy on the human clinical trial samples and its association with patient prognosis.
(A) Waterfall plot of predicted response scores for ICB clinical trial samples. The model trained on the syngeneic mouse model data was applied to predict ICB response in human clinical samples from different cohorts. The true label was obtained from the original articles. Boxplots group the predicted scores for each sample by patient response. The score difference between the two response groups was examined by the Mann-Whitney U test. ICB treatment, cancer type, and the sample size are specified in the cohort title. (B) Kaplan-Meier overall survival curves for predicted responders versus nonresponders. Cox proportional hazards regression analysis was used to test the significance of the association. Progression-free survival, PFS; overall survival, OS; non–small cell lung cancer, NSCLC; head-neck squamous cell carcinoma, HNSC. (C) The area under the receiver operating characteristic curve (AUC) score for our joint dimension reduction (jDR) approach and other commonly used biomarkers in predicting ICB response in multiple clinical trial cohorts. IFNg, interferon-γ.

