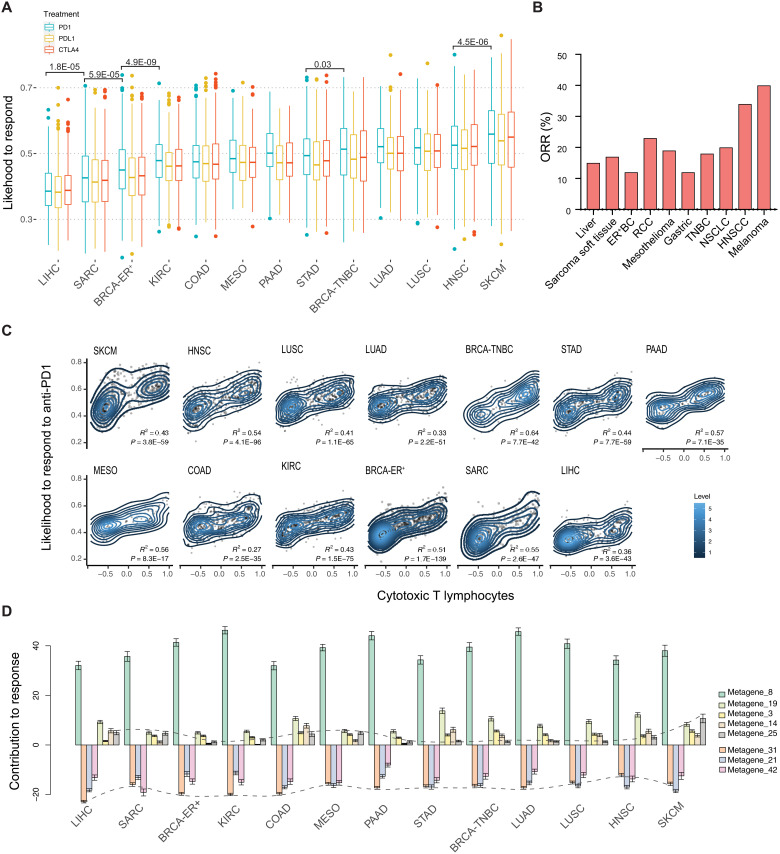
Fig. 4. Profiling of predicted ICB response on human clinical samples from TCGA.
(A) The simulated results of an individual’s predicted likelihood to respond to anti-PD1, anti-PDL1, and anti-CTLA4 treatment. The predicted scores are grouped by cancer type. Only TCGA cancer types with matched syngeneic mouse models were included. The difference between treatment groups was examined by the Mann-Whitney U test and only cancer types adjacent to each other were compared. (B) Objective response rates (ORR) per cancer upon anti-PD(L)1 monotherapy from reported studies. (C) The correlation between the predicted likelihood of anti-PD1 response and inferred CTL infiltration level. The R2 score and P values were derived from linear regressions. (D) Profiling of each factor’s enrichment across different cancer types. Positive scores indicate the factor positively contributed to the ICB response. Negative scores indicate resistance to ICB treatment. Scores for metagene_25 and metagene_31 were connected.

