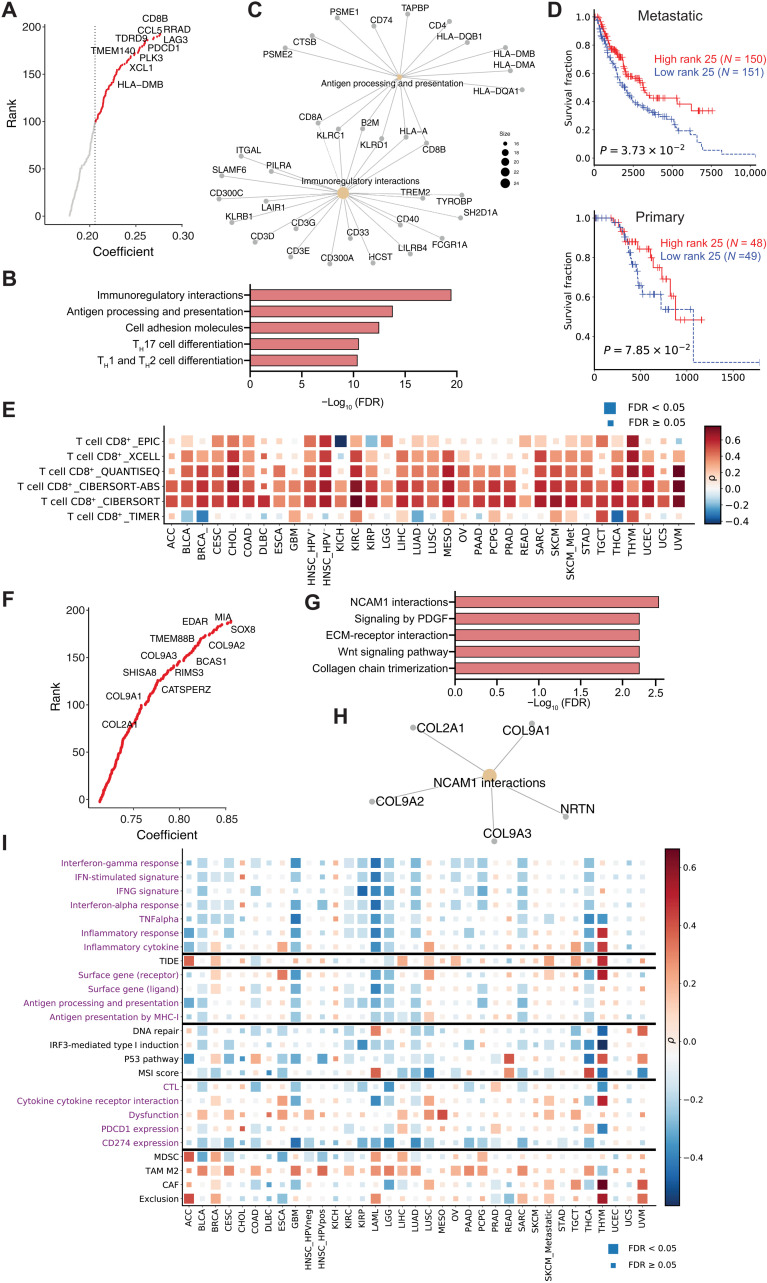
Fig. 5. Profiling of the metagenes derived from the dimension reductions.
(A) Top genes for metagene_25. (B) Pathway enrichment for the top 200 genes in metagene_25. (C) Gene symbols for the top two enriched pathways in metagene_25. (D) Kaplan-Meier overall survival curves for samples with high metagene_25 levels versus samples with low metagene_25 levels. The cohorts were split into high and low groups by the median score. Cox proportional hazards regression analysis was used to test the significance of the association. (E) The association between metagene_25 level and CTL infiltration level in TCGA samples. The significance of association was determined by Spearman correlation with adjustment for tumor purity. Multiple-hypothesis testing was adjusted by false discovery rate (FDR). (F) Top genes for metagene_31. (G) Pathway enrichment for the top 200 genes in metagene_31. (H) Gene symbols for the top two enriched pathways in metagene_31. (I) The association between metagene_31 level and different pathways and biomarkers (y axis) in TCGA samples. The associations between molecular phenotypes and pathways were computed for each cancer using Spearman’s partial correlation with tumor purity adjusted. The pathway expression was inferred by averaging the expression level of genes within that pathway. Color indicates the correlation coefficient (positive correlations are red and negative correlations are blue) and box size indicates the significance level (large box, FDR < 0.05; small box, not significant).

