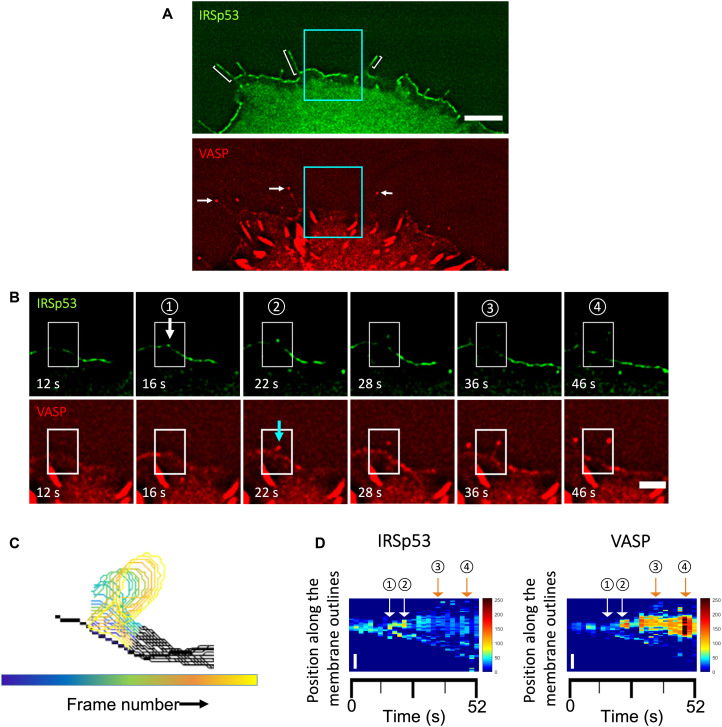
Fig. 1. Dynamics of VASP clusters assembled from preexisting IRSp53 clusters on the plasma membrane in filopodium initiation.
(A) Wide-field fluorescence image of a representative Rat2 cell transfected with IRSp53-eGFP and RFP-VASP. Brackets indicate some filopodia where IRSp53 is present along them. White arrows indicate the same filopodia to demonstrate that VASP is enriched in their tips. Scale bar, 5 μm. (B) Time-lapse images of a filopodium formation. Images are magnifications of the indicated area (cyan boxes) in (A). The white arrow indicates the appearance of an IRSp53 cluster followed by a VASP cluster indicated by a cyan arrow at the onset of filopodium formation. White boxes indicate the selected area used to generate outlines of plasma membrane positions over time shown in (C). Scale bar, 2 μm. (C) Colored outlines of membrane positions in the region indicated by the white boxes shown in (B). Total of 27 frames and frame interval of 2 s. (D) Adaptive kymograph maps replot the detected membrane profiles in (C) in the y axis and the corresponding time points in the x axis to show the dynamics of IRSp53 (left) and VASP (right) on the plasma membrane over time. Y axis shows the membrane positions of the proteins, and the x axis shows the time (in seconds; total of 27 frames). Scale bars, 1 μm (y axis). Color maps: Low fluorescence intensity is in blue, and high fluorescence intensity is in red. Circled numbers correspond to the frames indicated in (B).

