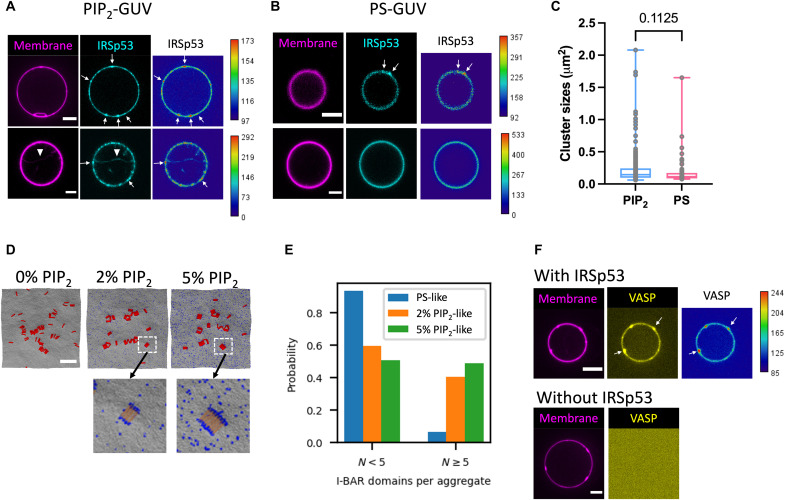
Fig. 2. IRSp53 self-assembles into clusters and recruits VASP on PIP2 membranes.
(A and B) Representative confocal images of GUVs incubated with AX488-labeled IRSp53 (16 nM). GUVs contain brain total lipid extract (TBX) with 0.5% TR-ceramide and either 5% PIP2 (PIP2-GUVs) in (A) or 25% 1,2-dioleoyl-sn-glycero-3-phospho-L-Serine (DOPS) (PS-GUVs) in (B). TR-ceramide in magenta and IRSp53 in cyan. Arrows indicate IRSp53 clusters on GUV membranes. Arrowhead indicates an inward membrane tube generated by IRSp53. Scale bar, 5 mm. (C) Sizes of IRSp53 clusters on PIP2-GUVs and on PS-GUVs. Each data point represents one cluster. PIP2-GUV: total of 225 clusters; N = 42 GUVs, three sample preparations. PS-GUV: total of 55 clusters; N = 12 GUVs, two sample preparations. Statistical analysis: two-tailed Mann-Whitney test, P = 0.1125. (D) Top: Representative snapshots of CG simulations from PS-like (0% PIP2), 2% PIP2-like, and 5% PIP2-like membranes. Membrane CG beads are in gray, PIP2-like CG beads are in blue, and I-BAR domains are in red. Scale bar, 50 nm. Bottom: Enlarged areas as indicated by the white dashed boxes. Only the central portion of the I-BAR domain is shown (yellow) to visualize PIP2 clusters (blue). (E) Probability of I-BAR domain aggregate size to be <5 or ≥5 molecules for membranes shown in (D). (F) Representative confocal images of GUVs incubated with AX488-labeled VASP (yellow) together with (top) or without (bottom) IRSp53 (unlabeled). Protein concentrations: 16 nM IRSp53 and 4 nM VASP. GUVs contain TBX with 0.5% TR-ceramide (magenta) and 5% PIP2. Heatmaps in (A) and (B) for IRSp53 signals and (F) for VASP signals; low fluorescence intensity is in blue, and high fluorescence intensity is in red. Scale bars, 5 μm.

