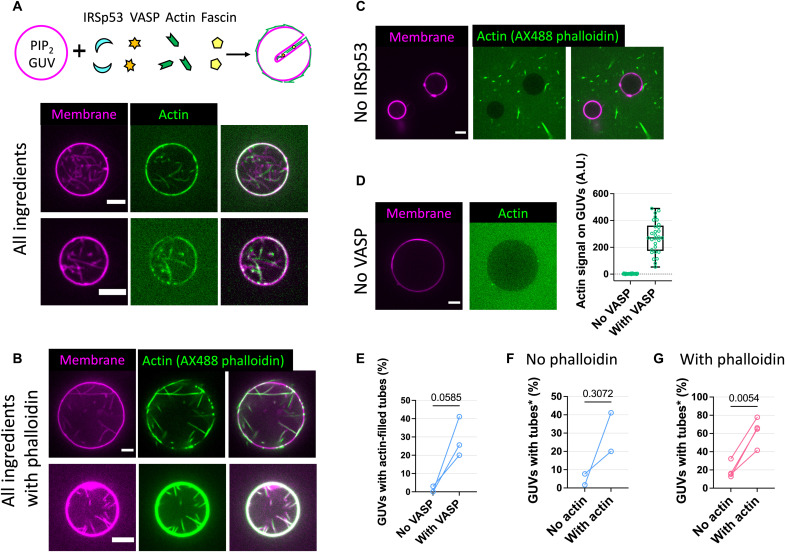
Fig. 3. IRSp53 and VASP synergistically drive the formation of actin-filled membrane protrusions.
(A to D) Representative GUVs (membranes, magenta; actin, green) incubated with (A) all proteins, (B) where actin was labeled instead with AX488 phalloidin, and where (C) IRSp53 and (D) VASP were excluded. Cartoon in (A) depicts GUVs incubated with all proteins (CP and profilin not shown). All proteins: IRSp53 (16 nM), VASP (4 nM), actin (0.5 μM; 10 to 27% AX488 labeled), fascin (250 nM), CP (25 nM), and profilin (0.6 μM). GUV composition: TBX, 0.5% TR-ceramide, and 5% PIP2. Scale bars, 5 μm. (D) Right: Pixel-averaged actin signals on GUVs. “No VASP,” N = 29 GUVs; “With VASP,” N = 29, one preparation (see fig. S12A for another two preparations). (E) Percentages of GUVs having actin-filled tubes with (“With VASP”) and without (“No VASP”) VASP. “With VASP,” N = 56, 39, and 45; “No VASP,” N = 42, 41, and 33; three preparations. Statistical analyses: chi-square test on pooled data, P < 0.0001; paired t test, P = 0.0585. (F and G) Percentages of tube-positive GUVs in the absence (“No actin”) and presence (“With actin”) of actin. “With actin” GUVs were counted only when having actin-filled tubes (*). (F) “No phalloidin” corresponds to AX488-labeled actin. “No actin,” N = 39 and 60; “With actin,” N = 45 and 56; two preparations. Statistical analyses: chi-square test on pooled data, P < 0.0001; paired t test, P = 0.3072. (G) In the presence of AX488 phalloidin and no AX488-labeled actin. “No actin,” N = 31, 31, 26, and 39; “With actin,” N = 54, 57, 41, and 56; four preparations. Statistical analyses: chi-square test on pooled data, P < 0.0001; paired t test, P = 0.0054.

