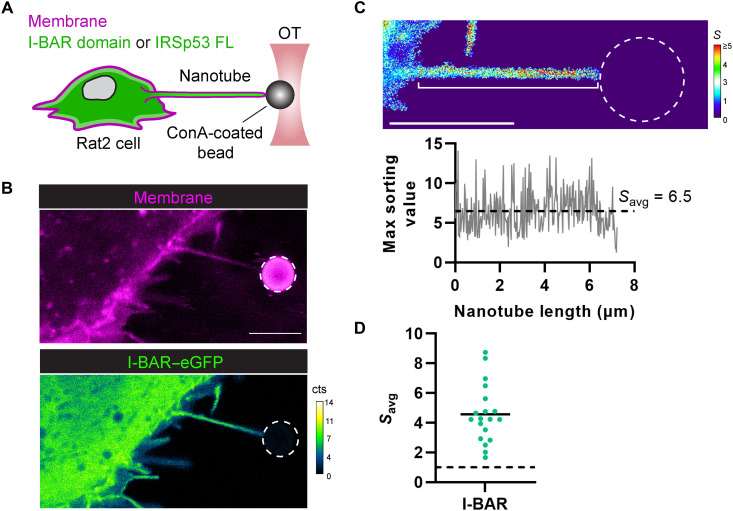
Fig. 5. IRSp53’s I-BAR domain is robustly recruited into pulled membrane nanotubes.
(A) Experimental setup for pulling membrane nanotubes using a concanavalin A (ConA)–coated bead trapped in an optical tweezer (OT). Rat2 fibroblasts, expressing eGFP fusions (green) of either IRSp53’s I-BAR domain or the full-length (FL) IRSp53 protein, were labeled with CellMask Deep Red plasma membrane stain (magenta); protein enrichment in the membrane nanotube was monitored by confocal fluorescence microscopy using single-photon avalanche detectors (cts, counts). (B) Representative confocal image of a pulled membrane nanotube from a Rat2 cell expressing IRSp53’s I-BAR domain showing high enrichment of the I-BAR domain. (C) Top: Calculated sorting map of the nanotube in (B) with low sorting (S) values in blue and high S values in red. Bottom: Plot of the maximum sorting value at each pixel position along the length of the nanotube (white bracket in the sorting map) and the mean sorting value for the protein (Savg). (D) Measured Savg values for IRSp53’s I-BAR domain in pulled nanotubes (N = 19 nanotubes). Savg > 1 (dashed black line) indicates protein enrichment. Black solid line, mean of the data points. Dashed white circles in the figure outline the trapped bead. Scale bars, 5 μm.

