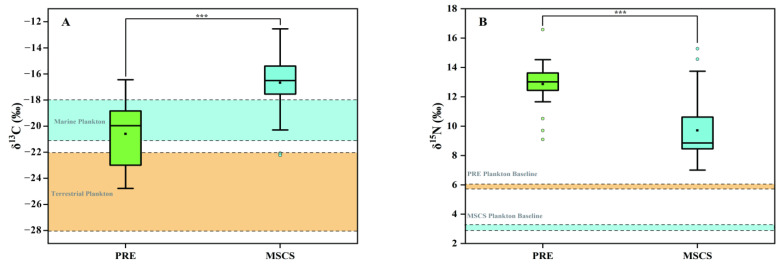
Figure 2.
(A) Box plot of δ13C values in fish collected from the Pearl River Estuarine (PRE) and the middle of the South China Sea (MSCS). The cyan and brown areas represent the range of δ13C values in marine plankton and terrestrial plankton reported by previous works [52,53]. (B) Box plot of δ15N values in fish collected from the PRE and the MSCS. The dashed lines of cyan and brown represent the baseline δ15N in phytoplankton collected from the MSCS and the PRE, respectively.*** represents that the data are significantly different between the PRE and the MSCS (p < 0.001).

