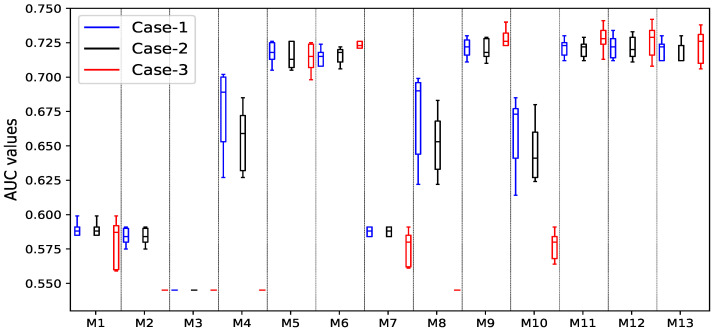
Figure 4.
Box and whisker plots of AUC results acquired from 5-fold cross-validation on different ML-based classifiers, where M-1 to M-13 represent GNB, BNB, RF, DT, XGB, LGB, GNB + BNB, RF + DT, LGB + XGB, GNB + BNB + DT + RF, GNB + BNB + XGB + LGB, DT + RF + LGB + XGB, and GNB + BNB + DT + RF + XGB + LGB, respectively.

