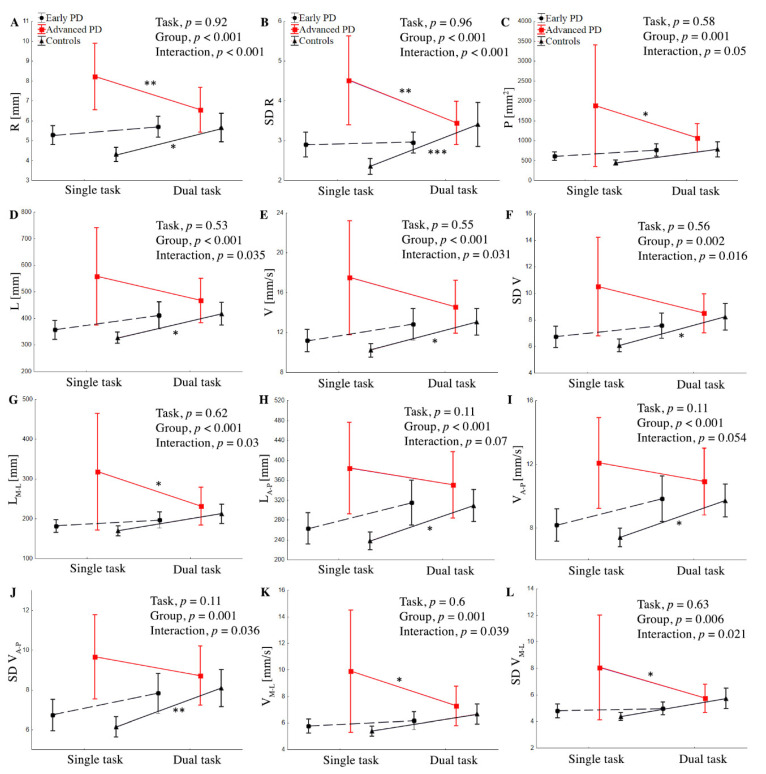
Figure 2.
Group mean values (±SD) of R (A), SD R (B), P (C), L (D), V (E), SD V (F), LM-L (G), LA-P (H), VA-P, (I), SD V (J), VM-L (K) SD VM-L (L) during single and dual task and interaction between group and task for stabilographic parameters. ANOVA results for means’ difference between the control and PD groups. Statistically significant differences are indicated as * p < 0.05, ** p < 0.01, and *** p < 0.001.

