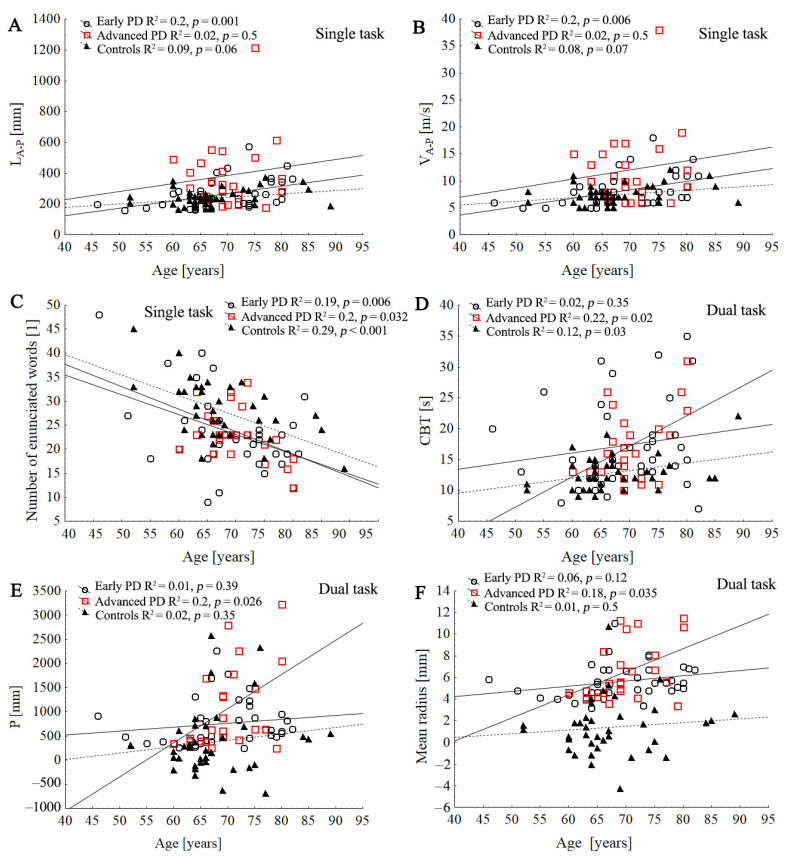
Figure 5.
Comparison of three regression slopes by means of an ANCOVA. Scatter plot of the association between the age with stabilographic parameters and cognitive function tests in control and PD groups during single and dual task: LA-P (A), VA-P, (B), number of enunciated words (C), CBT (D), P (E), mean radius (F). Lines represent the slope of the linear regression between the subjects’ age and the dependent variable.

