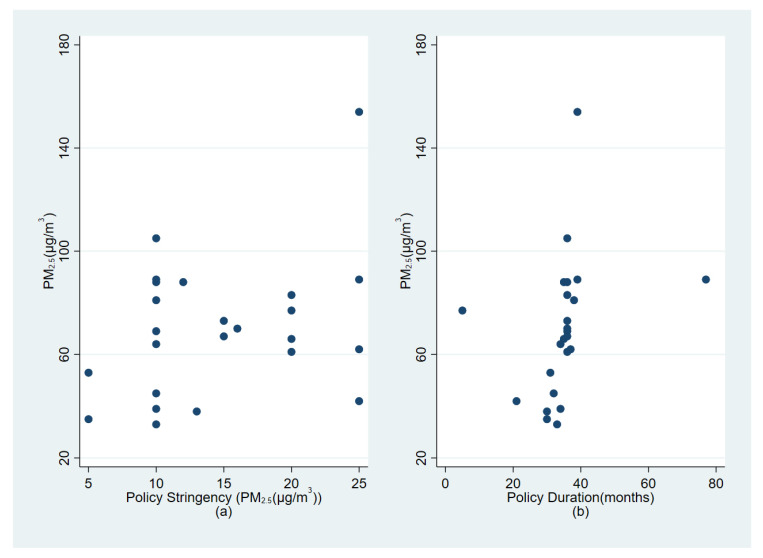
Figure 2.
Policy characteristics and air pollution levels before the intervention. Notes: The y-axis represents PM2.5 concentrations in the year before policy intervention. (a) The x-axis represents the policy stringency measured by the difference between the pre-intervention level of PM2.5 and the goal level of PM2.5. For example, the pre-intervention level of PM2.5 for Sichuan was 65 μg/m3, and the goal level of PM2.5 was 55 μg/m3, which is 10 μg/m3 (=65 − 55); (b) the x-axis represents the duration of the policy in months.

