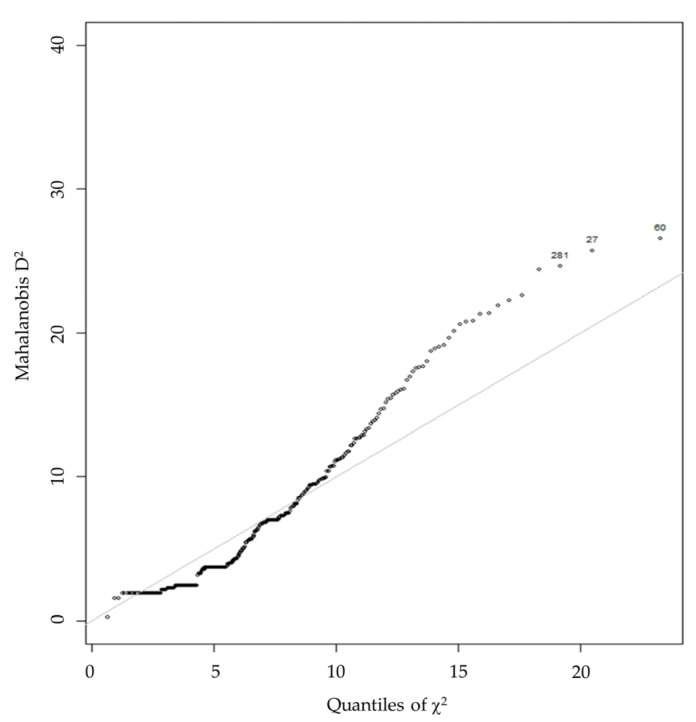
Figure 3.
Multivariate outliers in item set. Note. This plot of Mahalanobis D2 vs. quantiles of Chi2 shows an upward bending on the left side and a downward bending on the right side. This indicates possible outliers at the top end. However, as they are not found to be extremely unlikely, they were left in the sample size.

