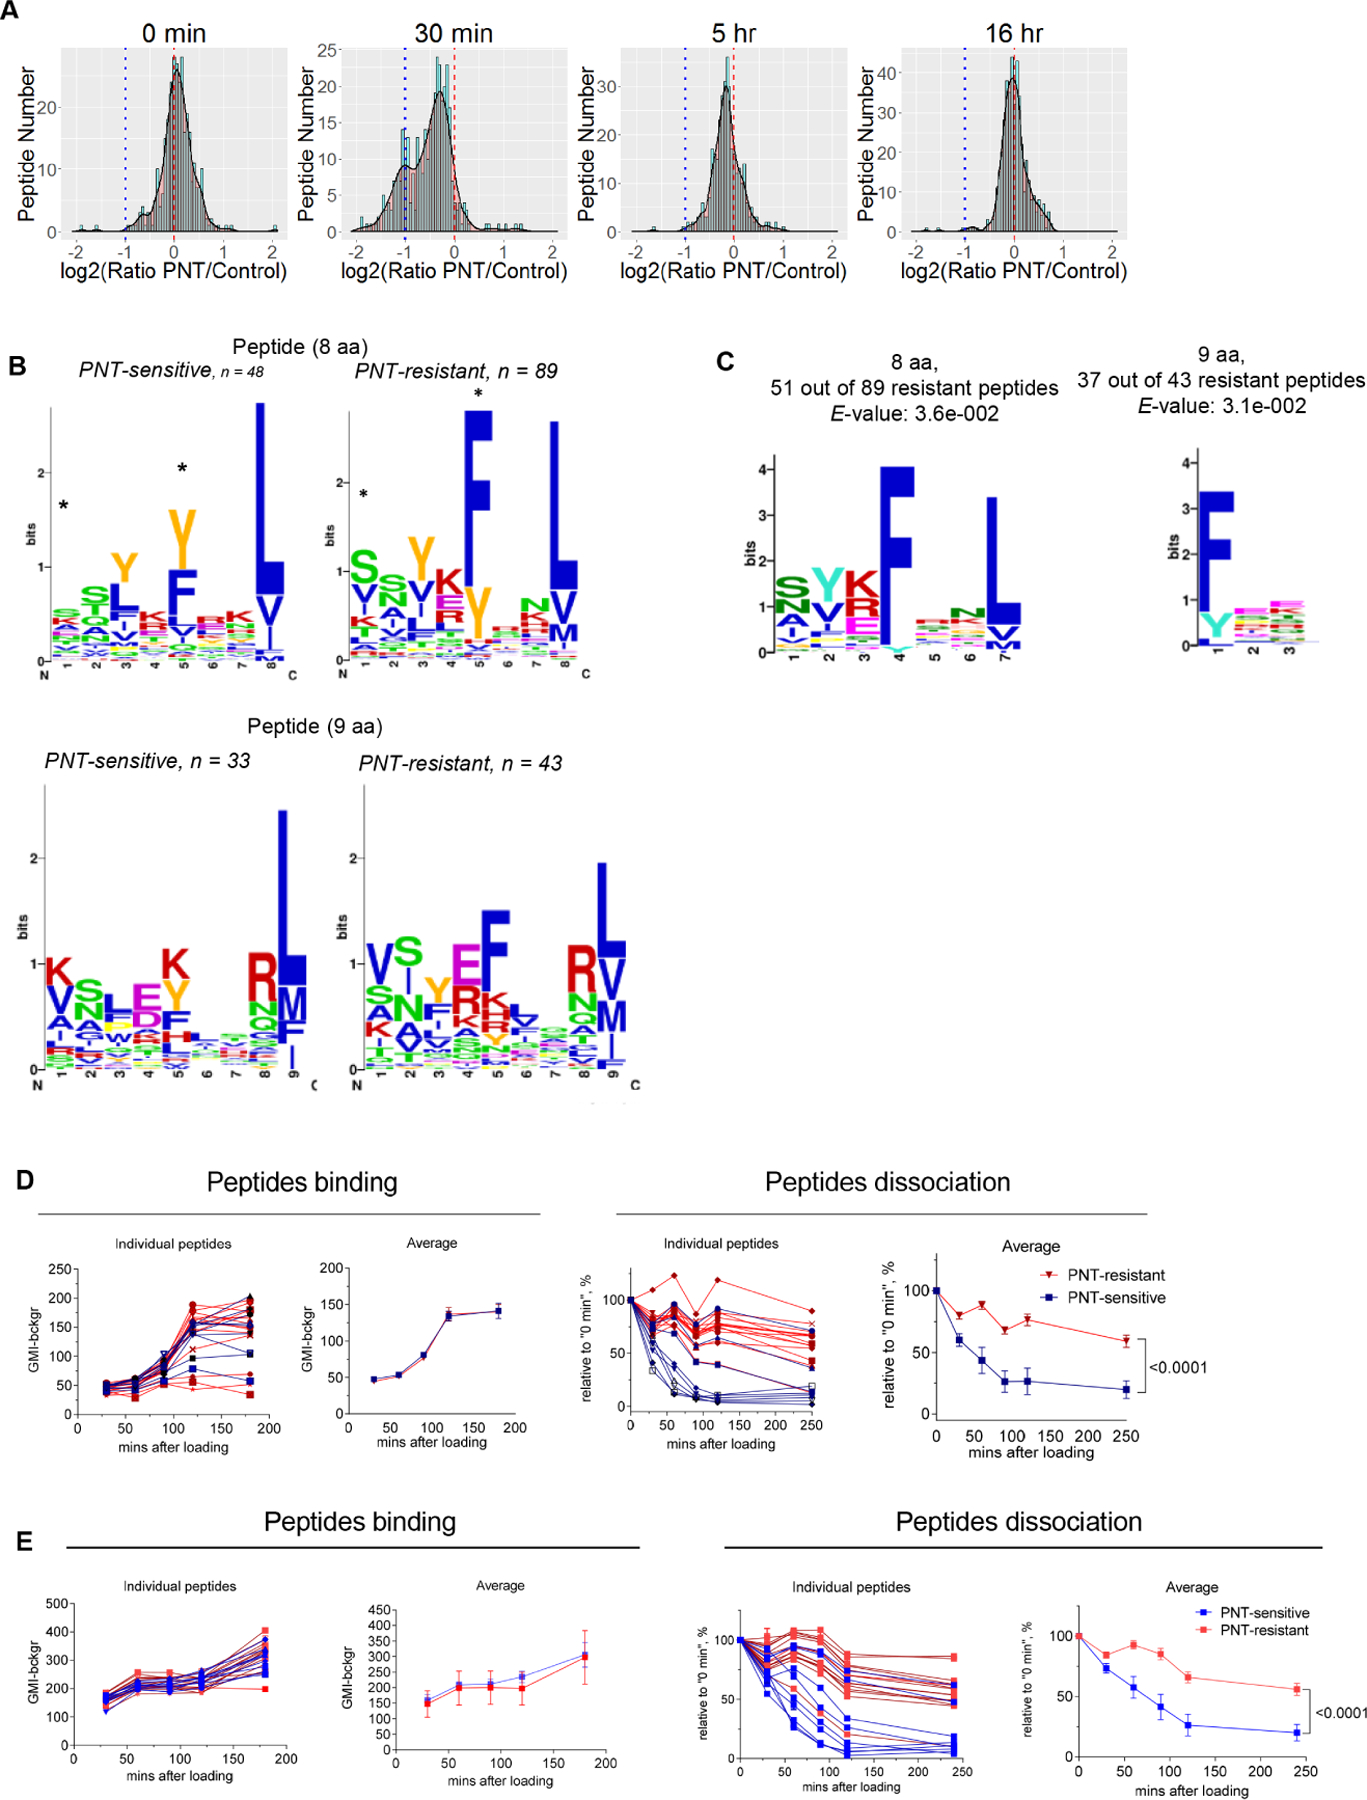
Figure. 1. PNT treatment changes MHC I peptide profile on tumor cells.

A. MHCI peptide profile in murine EG.7 cells after PNT treatment. The results are shown as frequency histograms of log2 (PNT/control) ratios for the abundance of the detected peptide species. Red dashed line designates 1:1 PNT/Control ratio, blue dotted line shows the decrease of PNT-treated peptide counterpart more than 2-fold. Scaled density plots for the same datasets are overlaid on the histogram to demonstrate the distribution. Results of one out of three similar experiments are shown. B. MHCI peptides from 30 min time-point are grouped according to their lengths and PNT/control ratio (less than 0.5 are designated as “PNT-sensitive” and more than 0.8 as “PNT-resistant”). The height of each bar is proportional to the degree of amino acid conservation, and the height of each letter composing the column is proportional to its frequency. Amino acids: hydrophobic (blue), polar uncharged side chains (green), with electrically charged side chains (red), proline and tyrosine - yellow and orange. For each position the amino acid content was compared between sensitive and resistant peptides and the significance of difference was tested with Fisher’s exact test with FDR adjustment, * p<0.05. C. The amino acid motif for octamers and nanomers enriched in resistant versus sensitive peptides with the corresponding E-value < 0.05 (calculated by MEME algorithm). D. Peptide binding to RMA-S cells (on the left) and the stability of pMHC complexes formed by those peptides (on the right). Three experiments with the same results were performed. Data shown as mean ± SD. P values were calculated in two-way ANOVA test. E. Effect of PNT on peptide-MHCI binding. RMA-S cells were pre-treated with PNT and then the same assays as in D were performed. Data shown as mean ± SD . P values were calculated in two-way ANOVA test. See also Figures S1-S3 and Tables S1-S3.
