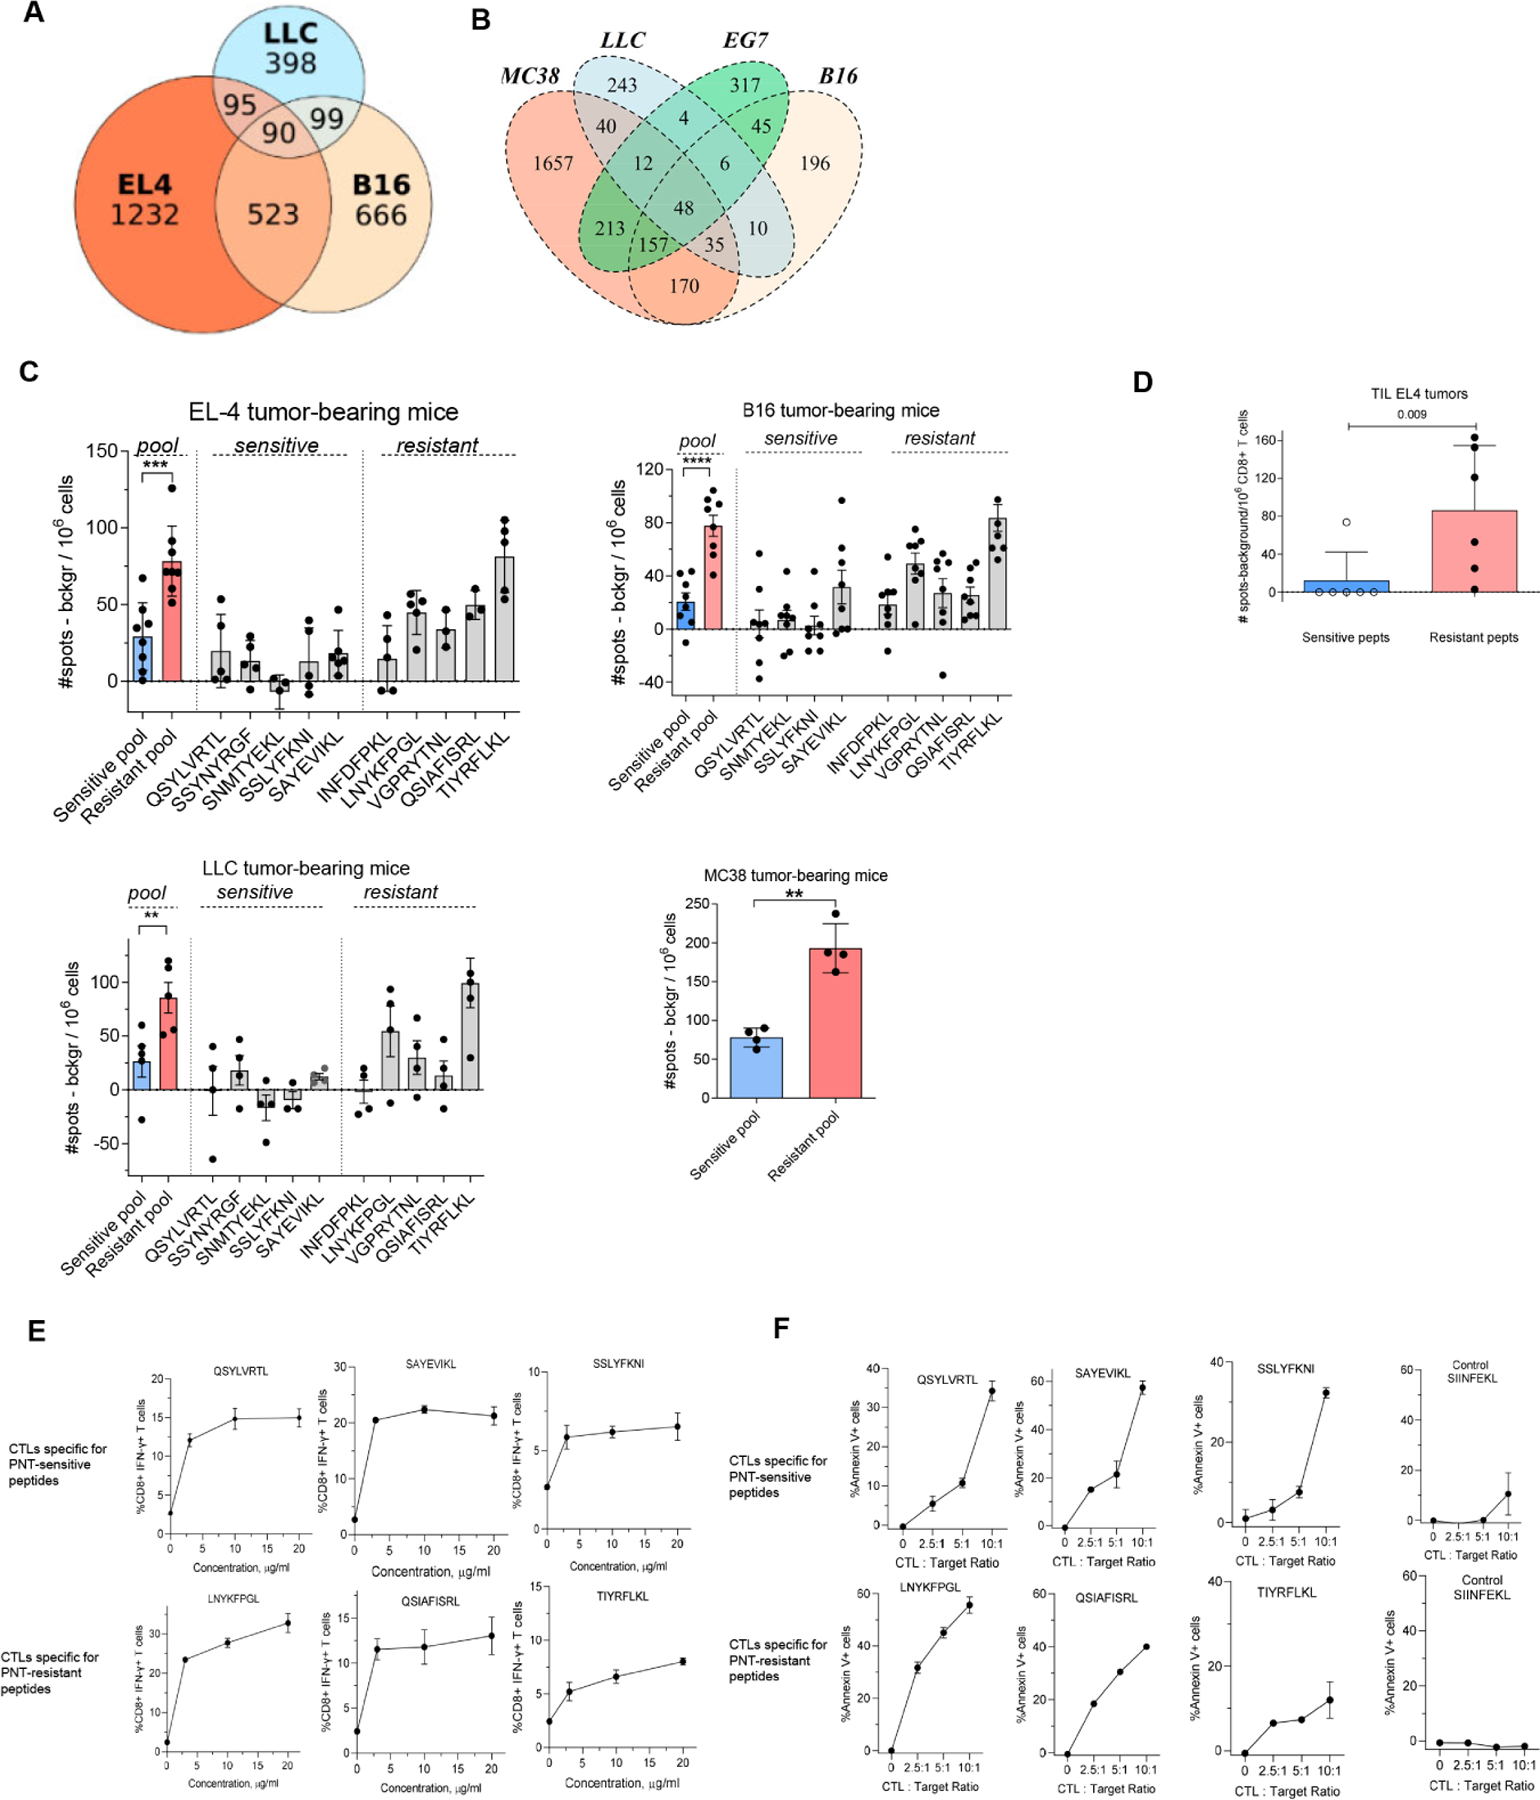
Figure 4. Spontaneous anti-tumor CD8+ T cell responses develop primarily against PNT-resistant peptides.

A. Datasets of MHCI peptides expressed by EL4, B16F10 and LLC were extracted from (Schuster et al., 2018) and analyzed for shared antigens and presented as a Venn diagram. B. Overlap of peptides detected in EG.7 cells with those reported (Schuster et al., 2018)(Yadav et al., 2014). C. Splenic CD8+ T cells were isolated from TB mice and re-stimulated with 2 μg/ml individual PNT-sensitive and PNT-resistant peptides or the pool of all 5 peptides for each group, 1 μg/ml each peptide. The amount of IFN-γ-producing peptide-specific CD8+ T cells was measured by ELISPOT, n= 4–8. ** - p<0.01, *** - p<0.001 in two-sided Student’s t-test. Data shown as Mean ± SD. D. Tumor CD8+ T cells were isolated from EL4 TB mice and re-stimulated with the pool of PNT-sensitive or resistant peptides. The amount of IFN-γ-producing peptide-specific CD8+ T cells was measured by ELISPOT (n=6). Mean and SD and p value in Mann-Whitney test are shown. E, F. Specificity of CTLs generated against PNT-sensitive and resistant peptides. T cells were generated by vaccinations and expansion in vitro. E. Purified CD8+ T cells were restimulated for 12 h in the presence of feeder cells (irradiated naïve splenocytes) with individual peptides used for immunization. The percentage of specific CD8+ T cells was evaluated by intracellular staining for IFN-γ. Mean and SD are shown. Each experiment was performed in duplicates. F. CTLs were tested against RMA-S cells loaded with the specific (indicated on the graph) or control (SIINFEKL) peptides. CTLs were added to the RMA-S cells in the presence of the peptides (to avoid impact of the differences in off-rate). Mean and SD are shown. Experiments were performed in duplicates. See also Figure S7.
