
Figure 6. PNT inhibition recovers CD8+ T cell responses to PNT-sensitive peptides and improves immunotherapy outcome.
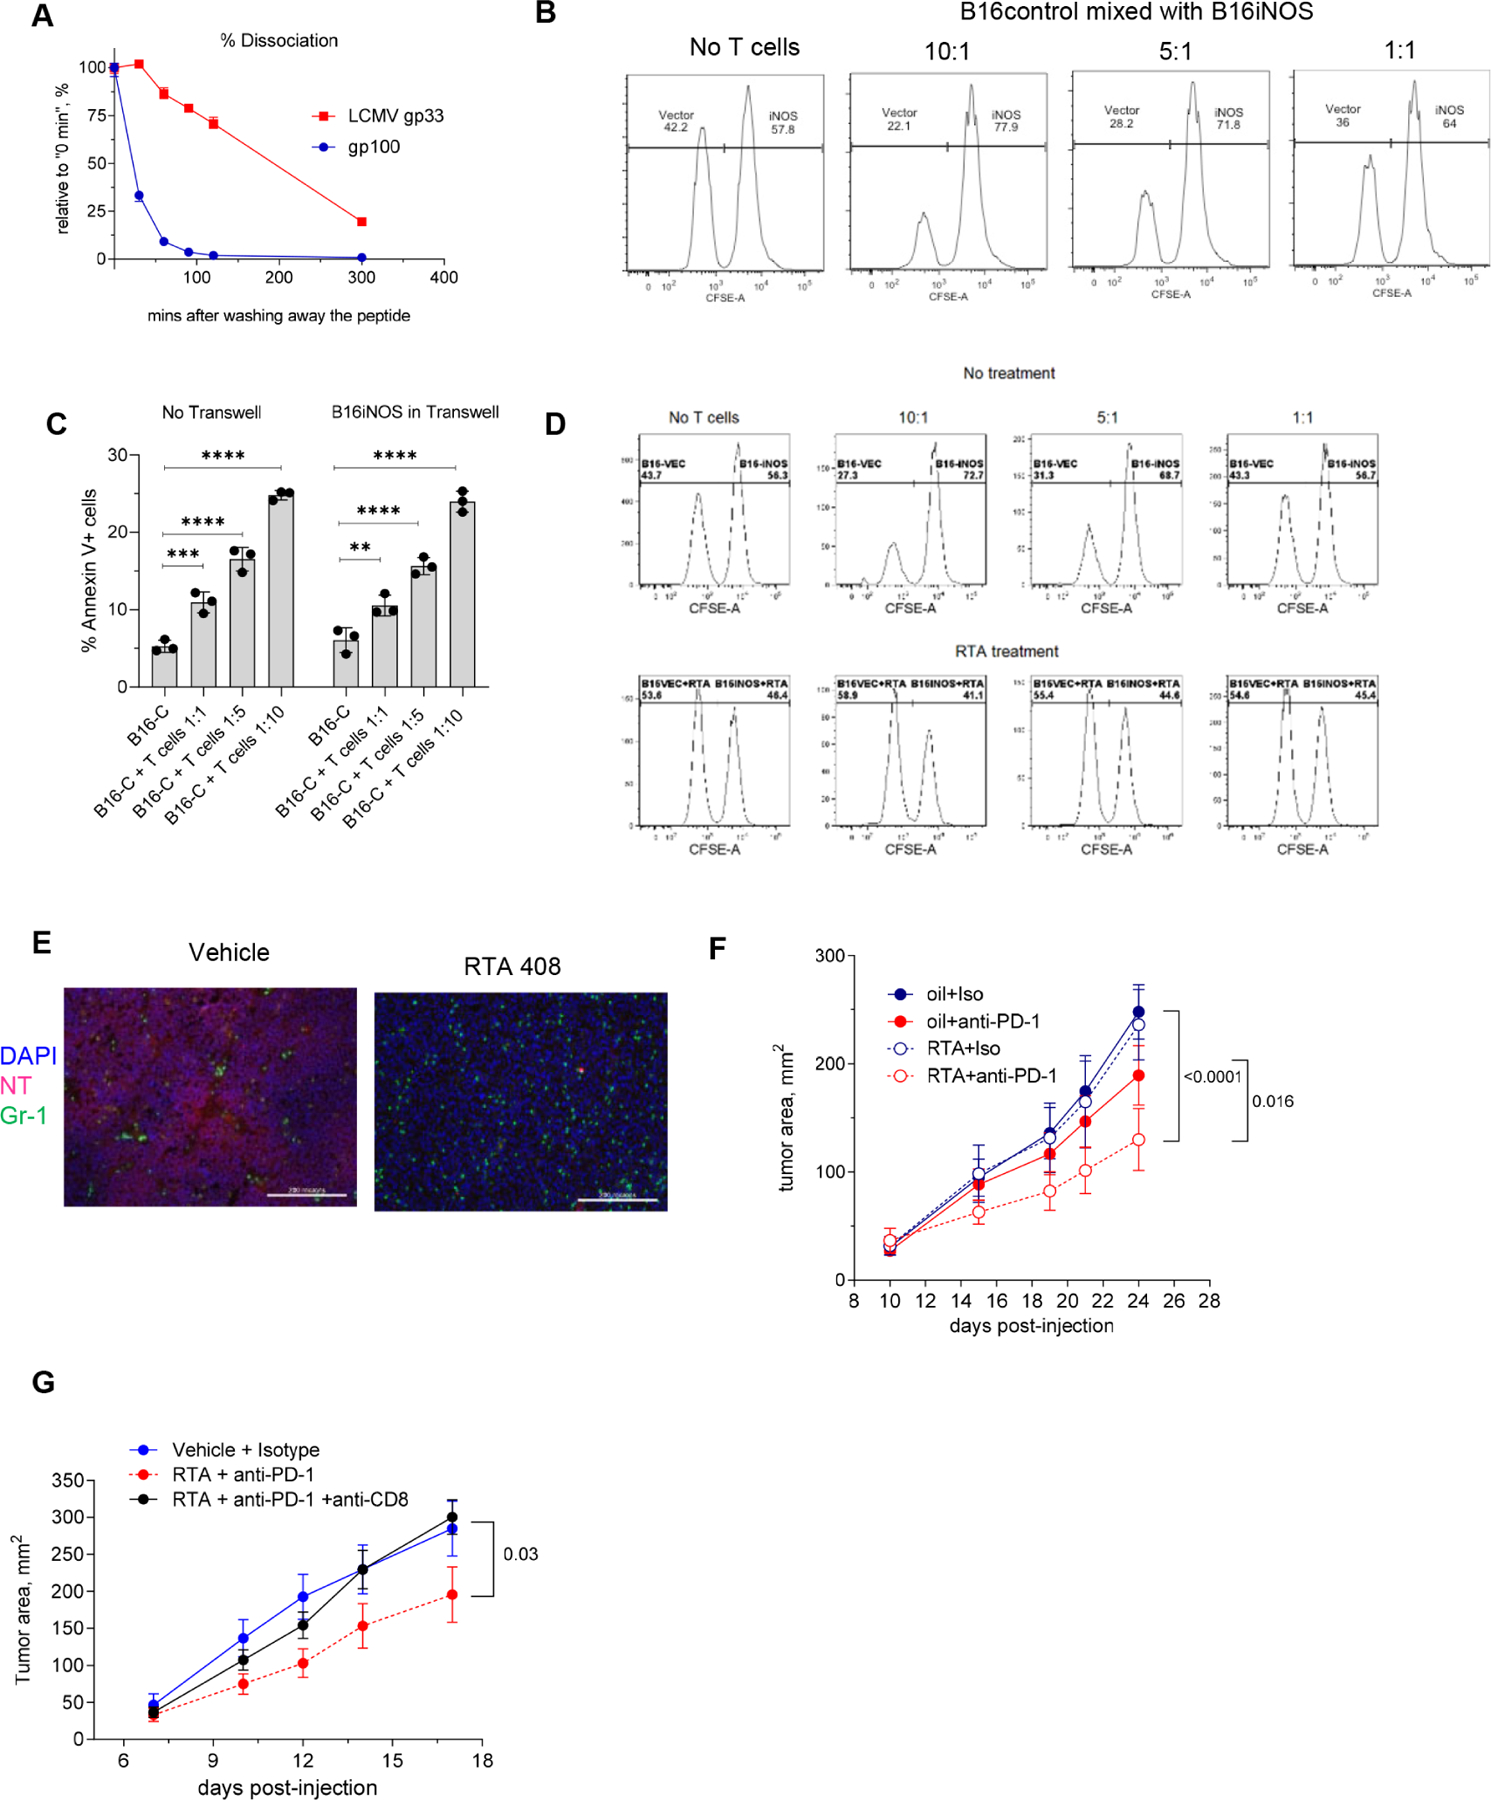
A. Dissociation rate for gp100 and control LCMV gp33 peptide was measured in RMA-S cell assay, H-2Db expression was measured by flow cytometry. n= 4. Experiment was performed twice with the same results. Data shown as means and SEM. B. B16F10 cells expressing control vector or iNOS were labeled with 0.5 μM and 5 μM CFSE, respectively, mixed at 1:1 ratio and co-cultured for 6 hours with activated Pmel-1 cells at indicated ratios and evaluated by flow cytometry. One of three representative experiments is shown. C. B16.F10 tumor cells expressing control construct (B16-C) cells were cocultured with the activated CD8+ Pmel-1 T cells at different ratios with or without B16-iNOS separated by 0.45 μm Transwell. Viability of target cells was assessed after 6 hours. Experiments were performed in triplicates. Mean and SD are shown. P values were calculated in one-way Anova test with correction for multiple comparisons. ** - p<0.01, *** - p<0.001; **** p<0.0001. D. B16F10-control and B16F10-iNOS cells were labeled with 0.5 μM and 5 μM CFSE, respectively, mixed at 1:1 ratio and were either left untreated (top panels) or pre-treated with RTA408 (Omaveloxolone, bottom panels). Cells were cultured with activated Pmel-1 cells at indicated ratios. One of three representative experiments is shown E. Immunofluorescent NT and Gr-1 staining of LLC tumor tissue from non-treated (left) or RTA408-treated animals. Scale bar – 200 μm. F. LLC tumor-bearing mice were treated with 1 mg/kg RTA408 starting from day 10 alone or in combination with 200 μg/ml anti-PD-1 antibody twice a week. N=8, p values were calculated in two-way ANOVA test. Data shown as means and SD. G. LLC tumor-bearing mice were treated as described above. For the depletion of CD8+ T cells mice received 100 μg/mouse anti-CD8 antibody twice a week starting from day 3. N=5 in treatment groups and n=4 in control group (vehicle+isotype). Statistics was calculated with two-way ANOVA test. Data shown as mean and SD.