
Figure 7. Antitumor effect of combination of nitroaspirin and PD-1 antibody.
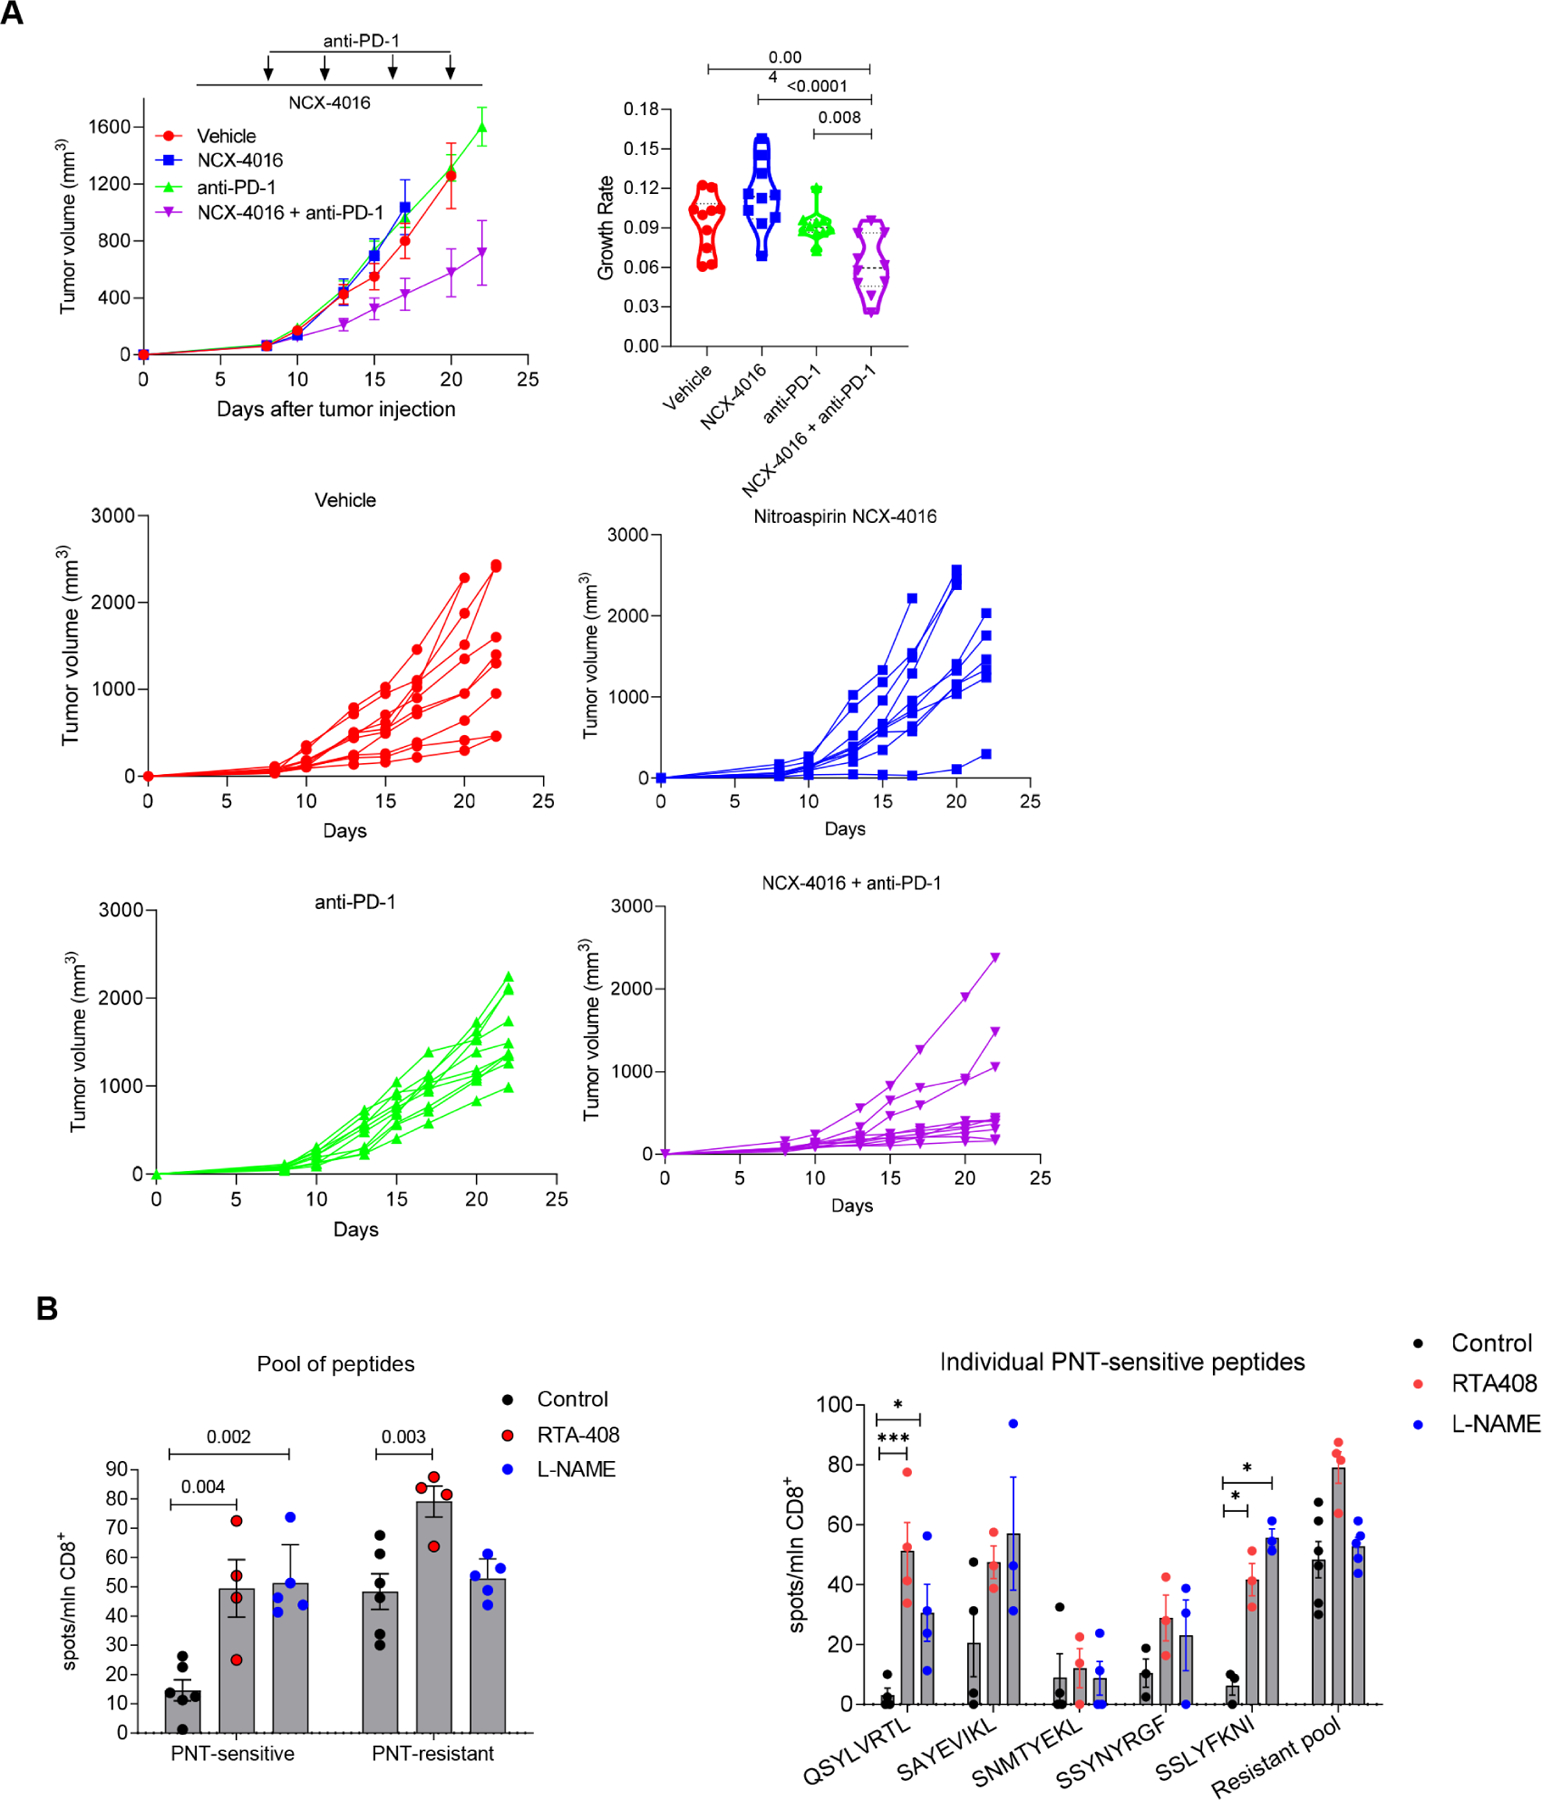
A. CT26 TB mice were treated with Nitroaspirin (NCX-4016) 12.5mg/kg PO every day from day 4 and/or PD-1 antibody 200μg/mouse twice a week from day 7. N=10. Top left panel – cumulative results of tumor size in the groups, data shown as mean and SD. Top right panel – tumor growth rate calculation, violin plots show median and quartiles as well as all data points. Bottom four panels results of individual mice in indicated treatment groups. P values were calculated in one-way ANOVA with correction for multiple comparisons. B. EL4 tumor-bearing mice were treated with 1 mg/kg RTA 408 daily or with 2 g/L L-NAME in drinking water ad libitum starting from day 4 after tumor injection. On day 17 mice were sacrificed, splenic CD8+ T cells were isolated and stimulated with 2 μg/ml individual peptides or the pool of all 5 specified peptides for each group (1 μg/ml of each peptide). The IFN-γ producing CD8+ T cells were measured in ELISPOT assay and calculated per 106 CD8+ T cells. Mean and SEM are shown. n=6 in control, 4 in RTA408 treated mice, and 5 in L-NAME treated mice. P values were calculated in one-way ANOVA test with correction for multiple comtarisons and are shown for pool of peptides. For individual peptides * - p<0.05, ** -p<0.01, ***-p<0.001.