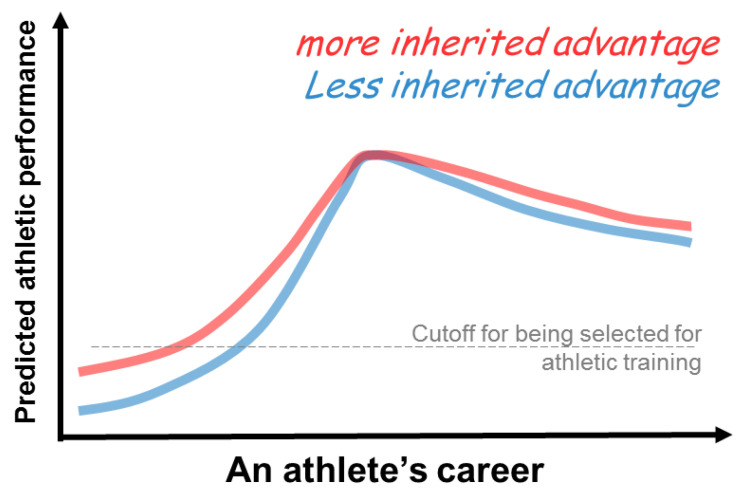
Figure 3.
A hypothetical plot for athletic performance over an athlete’s career span. The footing for those that inherited more sports talent (red line) is deemed higher than the footing for those with less sports talent (blue line). If there is no external interference throughout, the difference between the red and blue curves is expected to be smaller at the peaks. Conceivably, one with less talent would need to put in more effort to reach one’s peak level, as demonstrated by the steeper upward slope of the blue curve compared to the slope of the red curve.

