
Figure 6. Manipulating Pect levels in the fat body alters phospholipid profile.
(A) Average concentrations of phosphatidylcholine (PC), phosphatidylethanolamine (PE), lysophosphatidylcholine (LPC), and lysophosphatidylethanolamine (LPE) lipid classes in LppGal4>UAS-Pect-RNAi flies compared to control under 7-day normal food (NF) conditions. (B) Depicts the concentration of Pect-associated phospoholipids in LppGal4>UAS-Pect-RNAi flies compared to control. Lipidomics was performed using a targeted quantitative lipidyzer (Sciex 5500 Lipidyzer). 4–6 independent biological replicates were used for each genotype, with n = 10 flies composing one biological replicate. Unpaired t-test with Welch’s correction. Asterisks indicate significant changes with p-value<0.05, p-value<0.005, and p-value<0.0005. Error bars = standard deviation, points = individual replicate values.

Figure 6—figure supplement 1. Pect mRNA expression.
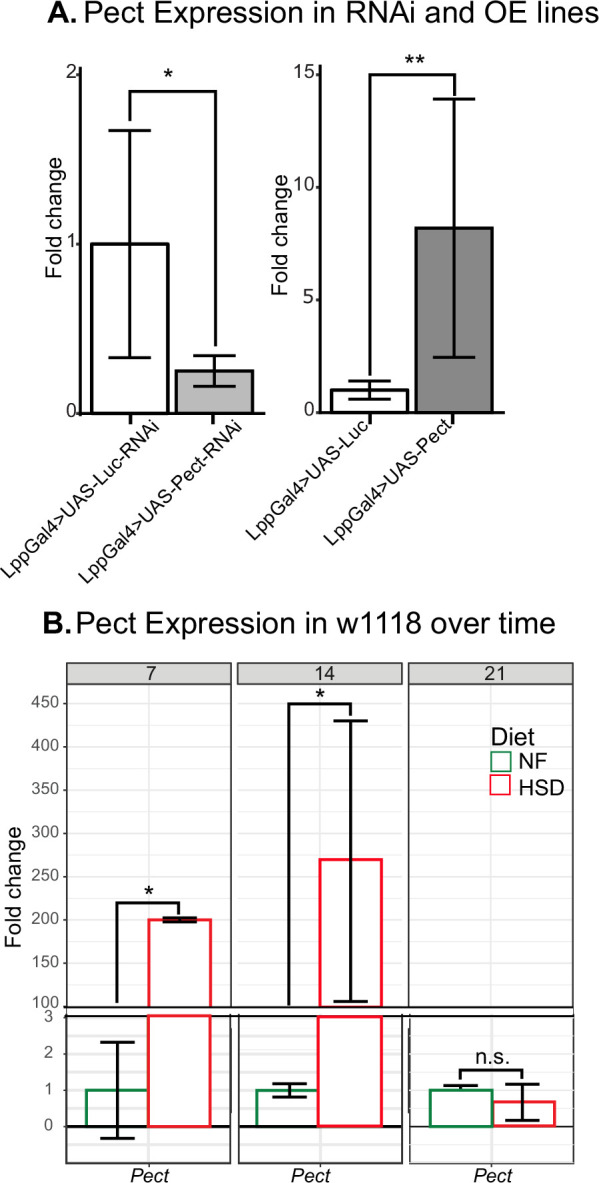
Figure 6—figure supplement 2. Fourteen days of high-sugar diet (HSD) cause an increase in Pect-associated phospholipid classes.

Figure 6—figure supplement 3. Additional lipid class responses to fat body Pect knockdown.

Figure 6—figure supplement 4. Lipidomic profile of fat body Pect overexpression flies.
